
- Start >
- Rivers >
- Waterlevel >
- Untere Donau >
- Aham >
- Chart of total period

Chart of total period Aham / Vils
Waterlevel from 01.11.1969 to 19.04.2024
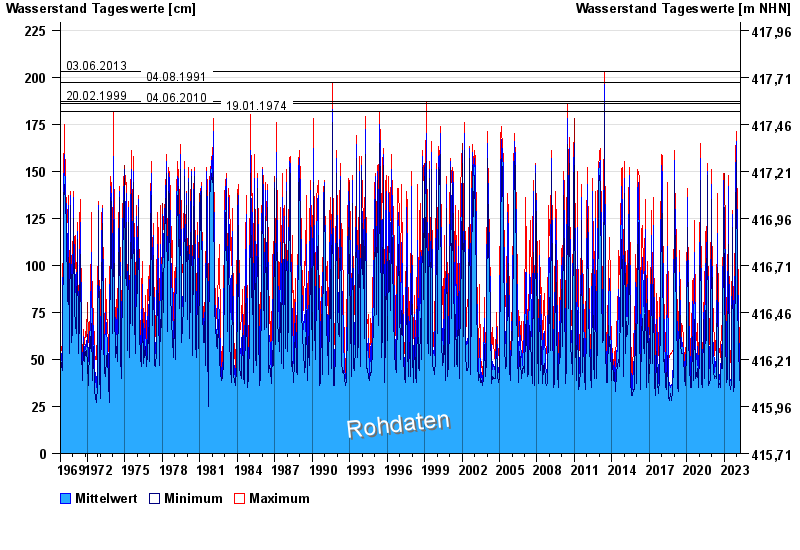
- 03.06.2013 Wasserstand: 203 cm
- 04.08.1991 Wasserstand: 197 cm
- 20.02.1999 Wasserstand: 187 cm
- 04.06.2010 Wasserstand: 186 cm
- 19.01.1974 Wasserstand: 182 cm
| Date | Mean value [cm] | Maximum [cm] | Minimum [cm] |
|---|---|---|---|
| 19.04.2024 | 40 | 40 | 39 |
| 18.04.2024 | 40 | 44 | 38 |
| 17.04.2024 | 37 | 39 | 36 |
| 16.04.2024 | 41 | 45 | 38 |
| 15.04.2024 | 36 | 39 | 34 |
| 14.04.2024 | 35 | 37 | 34 |
| 13.04.2024 | 35 | 37 | 34 |
© Bayerisches Landesamt für Umwelt 2024