
- Start >
- Rivers >
- Waterlevel >
- Naab - Regen >
- Wildenau >
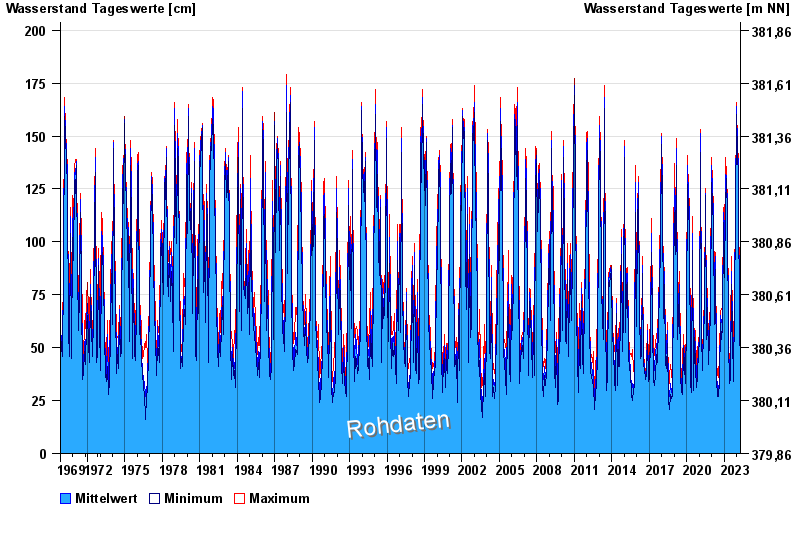
- Chart of total period

Chart of total period Wildenau / Haidenaab
Waterlevel from 01.11.1969 to 24.04.2024
| Date | Mean value [cm] | Maximum [cm] | Minimum [cm] |
|---|---|---|---|
| 24.04.2024 | 87 | 87 | 87 |
| 23.04.2024 | 85 | 87 | 79 |
| 22.04.2024 | 75 | 79 | 73 |
| 21.04.2024 | 67 | 74 | 58 |
| 20.04.2024 | 53 | 59 | 48 |
| 19.04.2024 | 46 | 49 | 45 |
| 18.04.2024 | 47 | 49 | 46 |
© Bayerisches Landesamt für Umwelt 2024