
- Start >
- Rivers >
- Waterlevel >
- Naab - Regen >
- Weiden >
- Chart of year

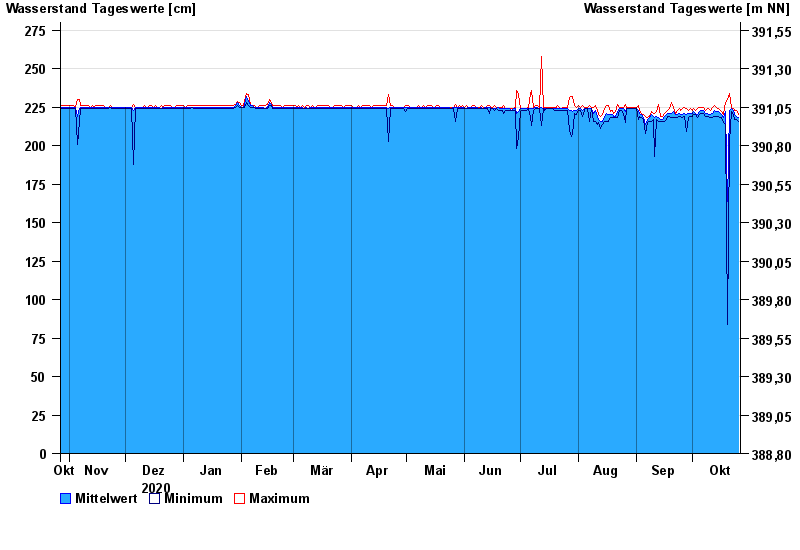
Chart of year Weiden / Waldnaab
Waterlevel from 27.10.2020 to 26.10.2021
| Date | Mean value [cm] | Maximum [cm] | Minimum [cm] |
|---|---|---|---|
| 26.10.2021 | 218 | 220 | 216 |
| 25.10.2021 | 219 | 223 | 217 |
| 24.10.2021 | 220 | 223 | 217 |
| 23.10.2021 | 223 | 224 | 220 |
| 22.10.2021 | 224 | 225 | 222 |
| 21.10.2021 | 223 | 234 | 203 |
| 20.10.2021 | 164 | 230 | 84 |
© Bayerisches Landesamt für Umwelt 2024