
- Start >
- Rivers >
- Waterlevel >
- Naab - Regen >
- Weiden >
- Chart of year

Chart of year Weiden / Waldnaab
Waterlevel from 20.10.2021 to 19.10.2022
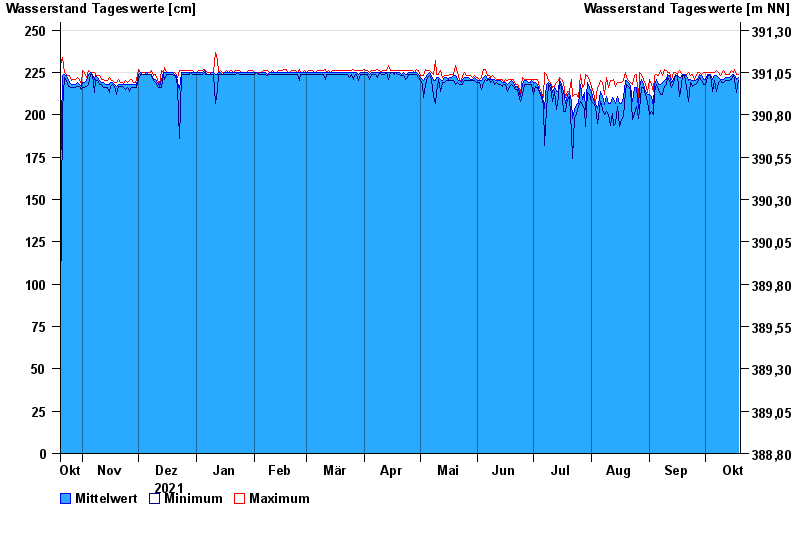
| Date | Mean value [cm] | Maximum [cm] | Minimum [cm] |
|---|---|---|---|
| 19.10.2022 | 222 | 224 | 220 |
| 18.10.2022 | 221 | 224 | 213 |
| 17.10.2022 | 223 | 227 | 221 |
| 16.10.2022 | 224 | 225 | 223 |
| 15.10.2022 | 223 | 226 | 221 |
| 14.10.2022 | 222 | 224 | 220 |
| 13.10.2022 | 222 | 224 | 220 |
© Bayerisches Landesamt für Umwelt 2024