
- Start >
- Rivers >
- Waterlevel >
- Naab - Regen >
- Warnbach >
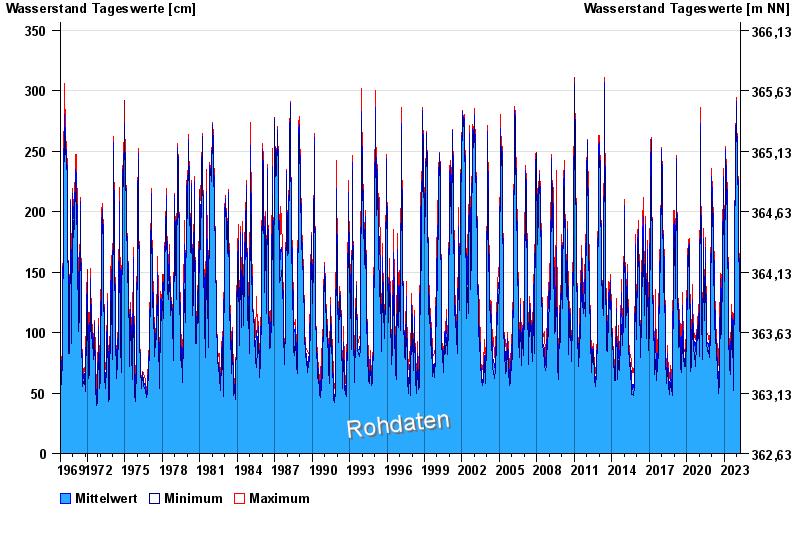
- Chart of total period

Chart of total period Warnbach / Schwarzach
Waterlevel from 01.11.1969 to 25.04.2024
| Date | Mean value [cm] | Maximum [cm] | Minimum [cm] |
|---|---|---|---|
| 25.04.2024 | 106 | 112 | 103 |
| 24.04.2024 | 122 | 134 | 113 |
| 23.04.2024 | 146 | 157 | 134 |
| 22.04.2024 | 178 | 201 | 157 |
| 21.04.2024 | 194 | 203 | 174 |
| 20.04.2024 | 154 | 173 | 133 |
| 19.04.2024 | 126 | 133 | 119 |
© Bayerisches Landesamt für Umwelt 2024