
- Start >
- Rivers >
- Waterlevel >
- Naab - Regen >
- Warnbach >
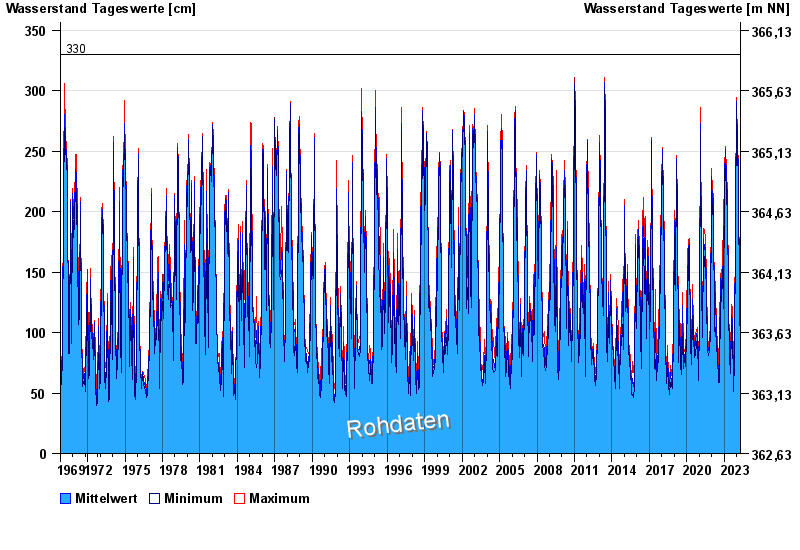
- Chart of total period

Chart of total period Warnbach / Schwarzach
Waterlevel from 01.11.1969 to 18.04.2024
 Für diesen Pegel sind keine Hochwassermarken hinterlegt.
| Date | Mean value [cm] | Maximum [cm] | Minimum [cm] |
|---|---|---|---|
| 18.04.2024 | 99 | 101 | 97 |
| 17.04.2024 | 104 | 109 | 89 |
| 16.04.2024 | 75 | 89 | 72 |
| 15.04.2024 | 66 | 72 | 63 |
| 14.04.2024 | 68 | 71 | 66 |
| 13.04.2024 | 74 | 76 | 71 |
| 12.04.2024 | 76 | 79 | 74 |
© Bayerisches Landesamt für Umwelt 2024