
- Start >
- Rivers >
- Waterlevel >
- Naab - Regen >
- Unterköblitz >
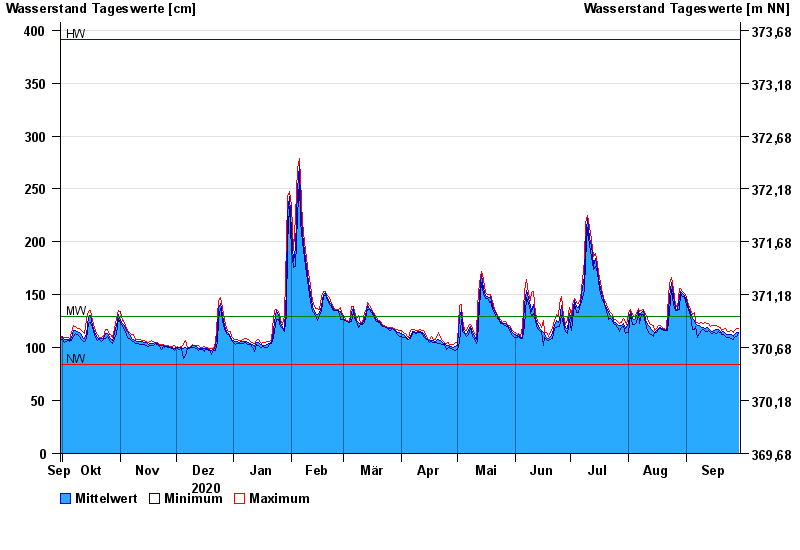
- Chart of year

Chart of year Unterköblitz / Naab
Waterlevel from 30.09.2020 to 29.09.2021
| Date | Mean value [cm] | Maximum [cm] | Minimum [cm] |
|---|---|---|---|
| 29.09.2021 | 114 | 118 | 113 |
| 28.09.2021 | 114 | 118 | 111 |
| 27.09.2021 | 112 | 116 | 110 |
| 26.09.2021 | 111 | 114 | 108 |
| 25.09.2021 | 112 | 116 | 109 |
| 24.09.2021 | 112 | 115 | 110 |
| 23.09.2021 | 112 | 115 | 110 |
© Bayerisches Landesamt für Umwelt 2024