
- Start >
- Rivers >
- Waterlevel >
- Naab - Regen >
- Unterköblitz >
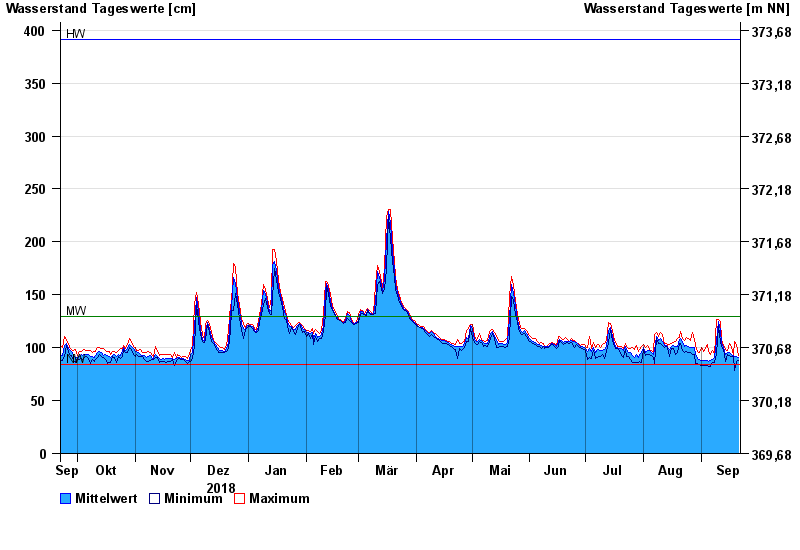
- Chart of year

Chart of year Unterköblitz / Naab
Waterlevel from 22.09.2018 to 21.09.2019
| Date | Mean value [cm] | Maximum [cm] | Minimum [cm] |
|---|---|---|---|
| 21.09.2019 | 91 | 93 | 88 |
| 20.09.2019 | 92 | 103 | 87 |
| 19.09.2019 | 92 | 106 | 78 |
| 18.09.2019 | 93 | 93 | 92 |
| 17.09.2019 | 94 | 101 | 92 |
| 16.09.2019 | 95 | 104 | 93 |
| 15.09.2019 | 95 | 97 | 94 |
© Bayerisches Landesamt für Umwelt 2024