
- Start >
- Rivers >
- Waterlevel >
- Naab - Regen >
- Unterköblitz >
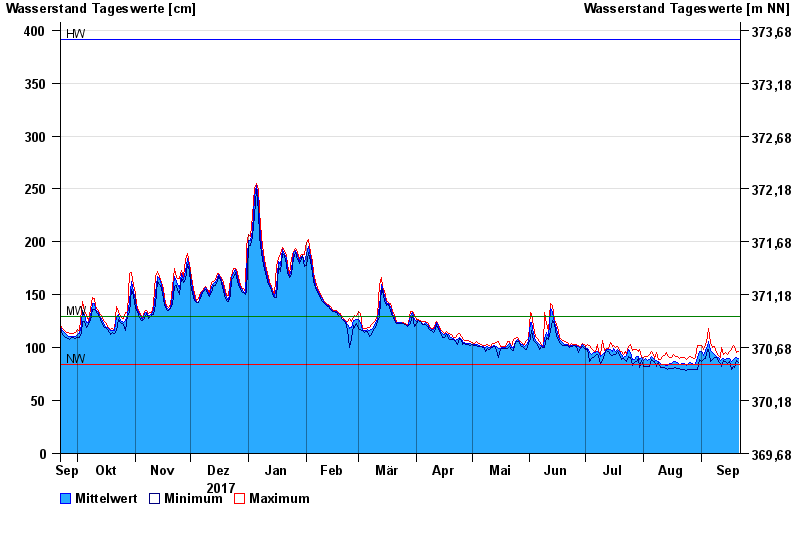
- Chart of year

Chart of year Unterköblitz / Naab
Waterlevel from 22.09.2017 to 21.09.2018
| Date | Mean value [cm] | Maximum [cm] | Minimum [cm] |
|---|---|---|---|
| 21.09.2018 | 90 | 96 | 86 |
| 20.09.2018 | 91 | 95 | 88 |
| 19.09.2018 | 90 | 101 | 81 |
| 18.09.2018 | 89 | 102 | 82 |
| 17.09.2018 | 87 | 98 | 79 |
| 16.09.2018 | 90 | 96 | 87 |
| 15.09.2018 | 90 | 94 | 85 |
© Bayerisches Landesamt für Umwelt 2024