
- Start >
- Rivers >
- Waterlevel >
- Naab - Regen >
- Unterköblitz >
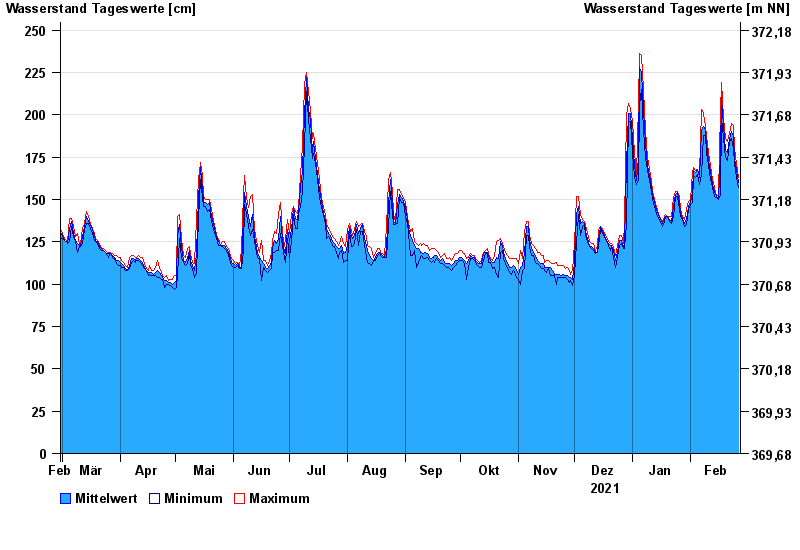
- Chart of year

Chart of year Unterköblitz / Naab
Waterlevel from 28.02.2021 to 27.02.2022
| Date | Mean value [cm] | Maximum [cm] | Minimum [cm] |
|---|---|---|---|
| 27.02.2022 | 160 | 163 | 157 |
| 26.02.2022 | 167 | 171 | 163 |
| 25.02.2022 | 175 | 180 | 171 |
| 24.02.2022 | 187 | 194 | 180 |
| 23.02.2022 | 190 | 195 | 186 |
| 22.02.2022 | 186 | 189 | 184 |
| 21.02.2022 | 178 | 184 | 173 |
© Bayerisches Landesamt für Umwelt 2024