
- Start >
- Rivers >
- Waterlevel >
- Naab - Regen >
- Unterköblitz >
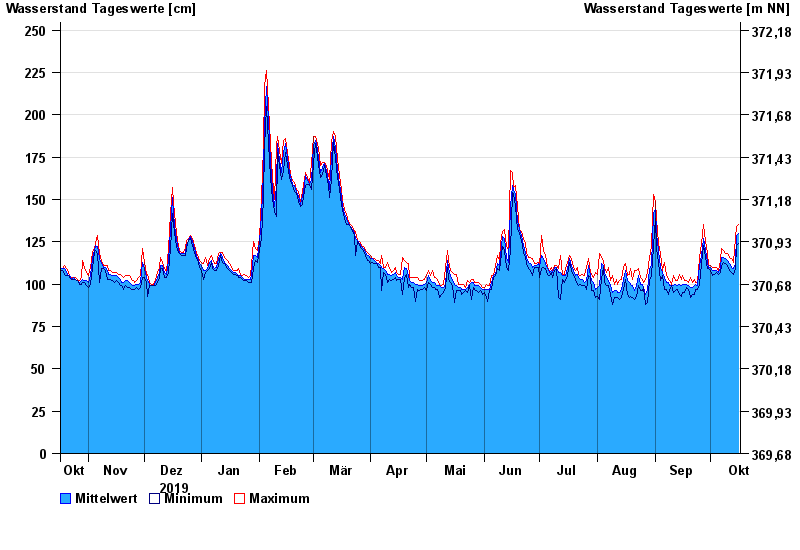
- Chart of year

Chart of year Unterköblitz / Naab
Waterlevel from 17.10.2019 to 16.10.2020
| Date | Mean value [cm] | Maximum [cm] | Minimum [cm] |
|---|---|---|---|
| 16.10.2020 | 130 | 135 | 124 |
| 15.10.2020 | 129 | 134 | 123 |
| 14.10.2020 | 112 | 127 | 109 |
| 13.10.2020 | 109 | 113 | 106 |
| 12.10.2020 | 110 | 115 | 107 |
| 11.10.2020 | 112 | 116 | 108 |
| 10.10.2020 | 114 | 118 | 111 |
© Bayerisches Landesamt für Umwelt 2024