
- Start >
- Rivers >
- Waterlevel >
- Naab - Regen >
- Unterköblitz >
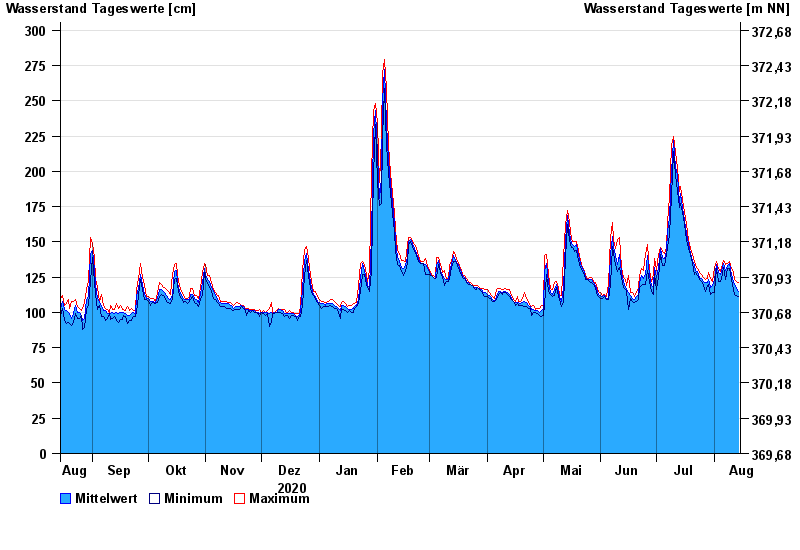
- Chart of year

Chart of year Unterköblitz / Naab
Waterlevel from 15.08.2020 to 14.08.2021
| Date | Mean value [cm] | Maximum [cm] | Minimum [cm] |
|---|---|---|---|
| 14.08.2021 | 115 | 121 | 111 |
| 13.08.2021 | 117 | 122 | 112 |
| 12.08.2021 | 120 | 123 | 113 |
| 11.08.2021 | 122 | 128 | 116 |
| 10.08.2021 | 127 | 131 | 123 |
| 09.08.2021 | 135 | 136 | 131 |
| 08.08.2021 | 133 | 135 | 131 |
© Bayerisches Landesamt für Umwelt 2024