
- Start >
- Rivers >
- Waterlevel >
- Naab - Regen >
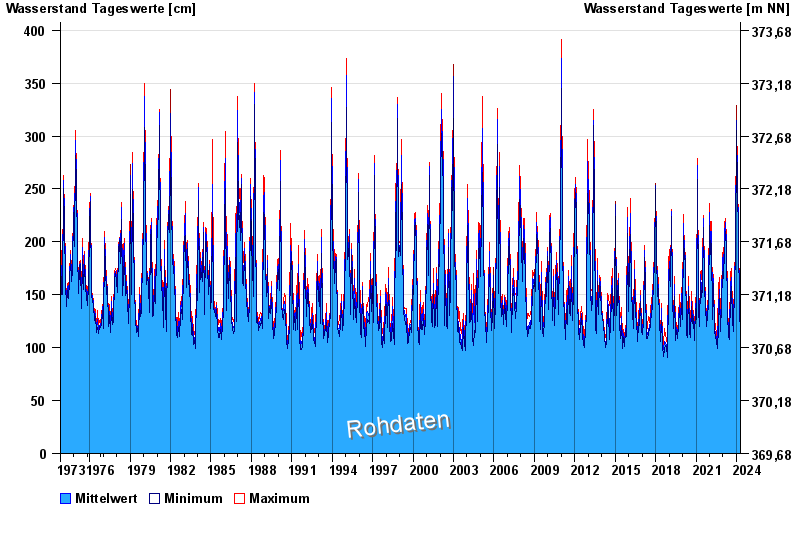
- Unterköblitz >
- Chart of total period

Chart of total period Unterköblitz / Naab
Waterlevel from 01.11.1973 to 19.04.2024
| Date | Mean value [cm] | Maximum [cm] | Minimum [cm] |
|---|---|---|---|
| 19.04.2024 | 117 | 117 | 116 |
| 18.04.2024 | 119 | 120 | 117 |
| 17.04.2024 | 119 | 120 | 114 |
| 16.04.2024 | 110 | 115 | 107 |
| 15.04.2024 | 110 | 113 | 108 |
| 14.04.2024 | 108 | 110 | 107 |
| 13.04.2024 | 109 | 112 | 108 |
© Bayerisches Landesamt für Umwelt 2024