
- Start >
- Rivers >
- Waterlevel >
- Naab - Regen >
- Unterköblitz >
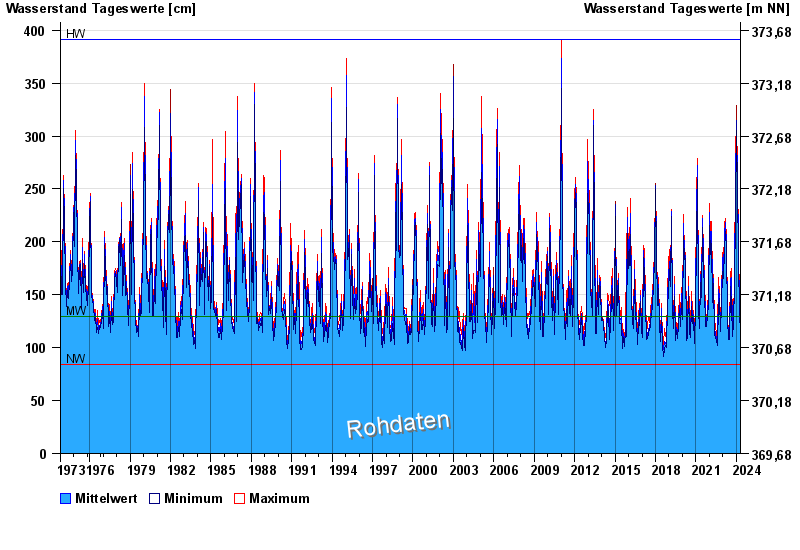
- Chart of total period

Chart of total period Unterköblitz / Naab
Waterlevel from 01.11.1973 to 23.04.2024
| Date | Mean value [cm] | Maximum [cm] | Minimum [cm] |
|---|---|---|---|
| 23.04.2024 | 151 | 152 | 149 |
| 22.04.2024 | 152 | 154 | 149 |
| 21.04.2024 | 141 | 151 | 137 |
| 20.04.2024 | 132 | 139 | 122 |
| 19.04.2024 | 116 | 122 | 114 |
| 18.04.2024 | 119 | 120 | 117 |
| 17.04.2024 | 119 | 120 | 114 |
© Bayerisches Landesamt für Umwelt 2024