
- Start >
- Rivers >
- Waterlevel >
- Naab - Regen >
- Unterbruck >
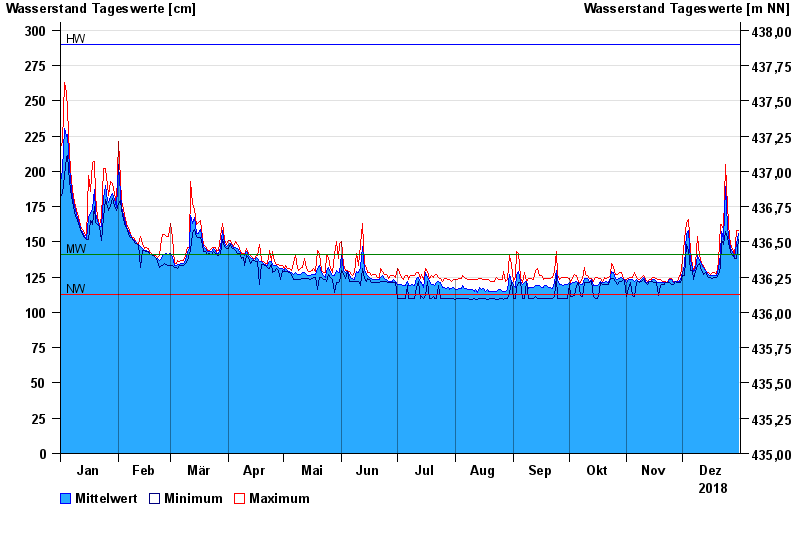
- Chart of year

Chart of year Unterbruck / Haidenaab
Waterlevel from 01.01.2018 to 31.12.2018
| Date | Mean value [cm] | Maximum [cm] | Minimum [cm] |
|---|---|---|---|
| 31.12.2018 | 156 | 158 | 152 |
| 30.12.2018 | 149 | 158 | 138 |
| 29.12.2018 | 139 | 140 | 138 |
| 28.12.2018 | 141 | 143 | 140 |
| 27.12.2018 | 144 | 146 | 141 |
| 26.12.2018 | 149 | 153 | 146 |
| 25.12.2018 | 161 | 175 | 153 |
© Bayerisches Landesamt für Umwelt 2024