
- Start >
- Rivers >
- Waterlevel >
- Naab - Regen >
- Unterbruck >
- Chart of total period

Chart of total period Unterbruck / Haidenaab
Waterlevel from 01.11.1976 to 24.04.2024
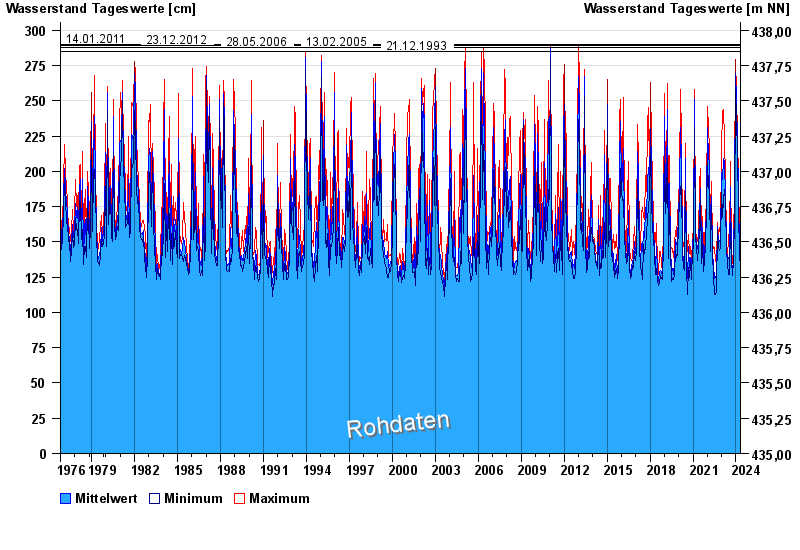
- 14.01.2011 Wasserstand: 290 cm
- 23.12.2012 Wasserstand: 289 cm
- 28.05.2006 Wasserstand: 288 cm
- 13.02.2005 Wasserstand: 288 cm
- 21.12.1993 Wasserstand: 285 cm
| Date | Mean value [cm] | Maximum [cm] | Minimum [cm] |
|---|---|---|---|
| 24.04.2024 | 150 | 151 | 149 |
| 23.04.2024 | 158 | 170 | 151 |
| 22.04.2024 | 173 | 188 | 165 |
| 21.04.2024 | 163 | 188 | 147 |
| 20.04.2024 | 155 | 159 | 148 |
| 19.04.2024 | 133 | 148 | 129 |
| 18.04.2024 | 131 | 132 | 129 |
© Bayerisches Landesamt für Umwelt 2024