
- Start >
- Rivers >
- Waterlevel >
- Naab - Regen >
- Trausnitz u. d. Mühle >
- Chart of year

Chart of year Trausnitz u. d. Mühle / Pfreimd
Waterlevel from 01.01.2019 to 31.12.2019
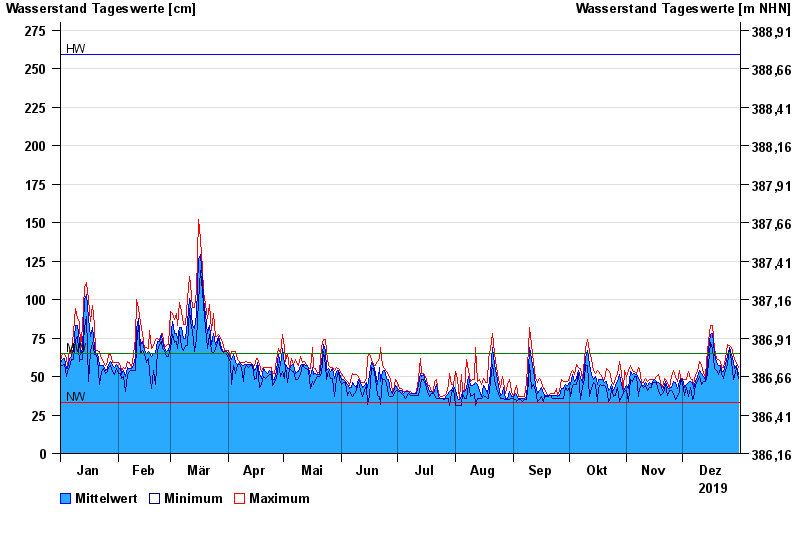
| Date | Mean value [cm] | Maximum [cm] | Minimum [cm] |
|---|---|---|---|
| 31.12.2019 | 51 | 56 | 49 |
| 30.12.2019 | 57 | 59 | 56 |
| 29.12.2019 | 55 | 61 | 50 |
| 28.12.2019 | 59 | 64 | 48 |
| 27.12.2019 | 64 | 69 | 60 |
| 26.12.2019 | 69 | 70 | 69 |
| 25.12.2019 | 63 | 71 | 58 |
© Bayerisches Landesamt für Umwelt 2024