
- Start >
- Rivers >
- Waterlevel >
- Naab - Regen >
- Teisnach >
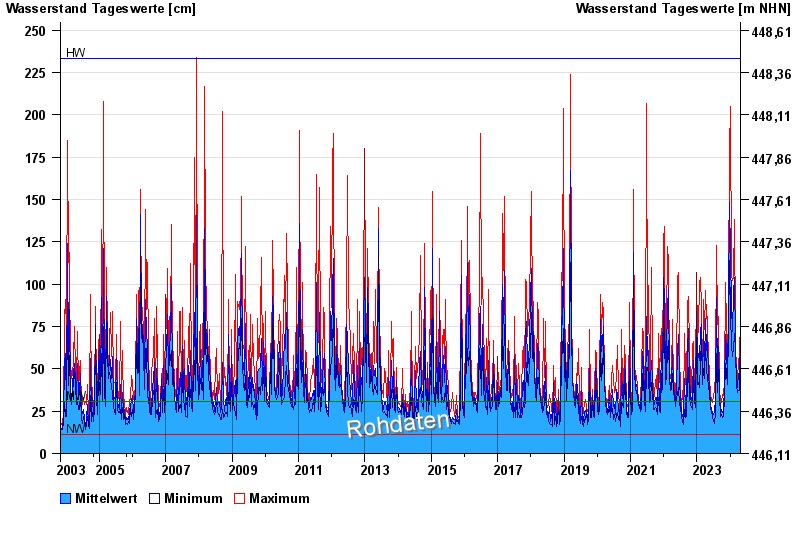
- Chart of total period

Chart of total period Teisnach / Teisnach
Waterlevel from 01.11.2003 to 23.04.2024
| Date | Mean value [cm] | Maximum [cm] | Minimum [cm] |
|---|---|---|---|
| 23.04.2024 | 43 | 44 | 41 |
| 22.04.2024 | 47 | 53 | 44 |
| 21.04.2024 | 51 | 58 | 47 |
| 20.04.2024 | 73 | 93 | 58 |
| 19.04.2024 | 46 | 92 | 34 |
| 18.04.2024 | 37 | 39 | 35 |
| 17.04.2024 | 40 | 45 | 37 |
© Bayerisches Landesamt für Umwelt 2024