
- Start >
- Rivers >
- Waterlevel >
- Naab - Regen >
- Schwabelweis >
- Chart of total period

Chart of total period Schwabelweis / Donau
Waterlevel from 31.10.1927 to 25.04.2024
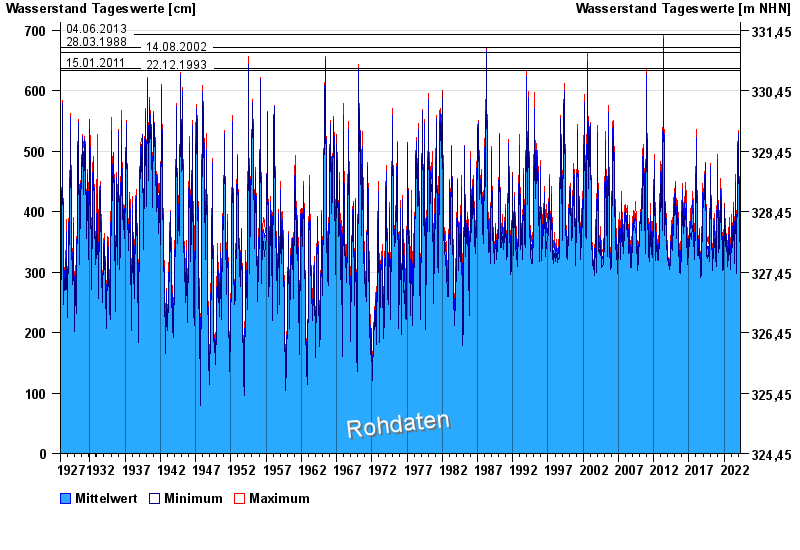
- 04.06.2013 Wasserstand: 693 cm
- 28.03.1988 Wasserstand: 672 cm
- 14.08.2002 Wasserstand: 663 cm
- 15.01.2011 Wasserstand: 636 cm
- 22.12.1993 Wasserstand: 634 cm
| Date | Mean value [cm] | Maximum [cm] | Minimum [cm] |
|---|---|---|---|
| 25.04.2024 | 313 | 317 | 309 |
| 24.04.2024 | 315 | 319 | 311 |
| 23.04.2024 | 325 | 332 | 318 |
| 22.04.2024 | 332 | 334 | 330 |
| 21.04.2024 | 335 | 340 | 329 |
| 20.04.2024 | 325 | 328 | 322 |
| 19.04.2024 | 324 | 327 | 321 |
© Bayerisches Landesamt für Umwelt 2024