
- Start >
- Rivers >
- Waterlevel >
- Naab - Regen >
- Schmidmühlen >
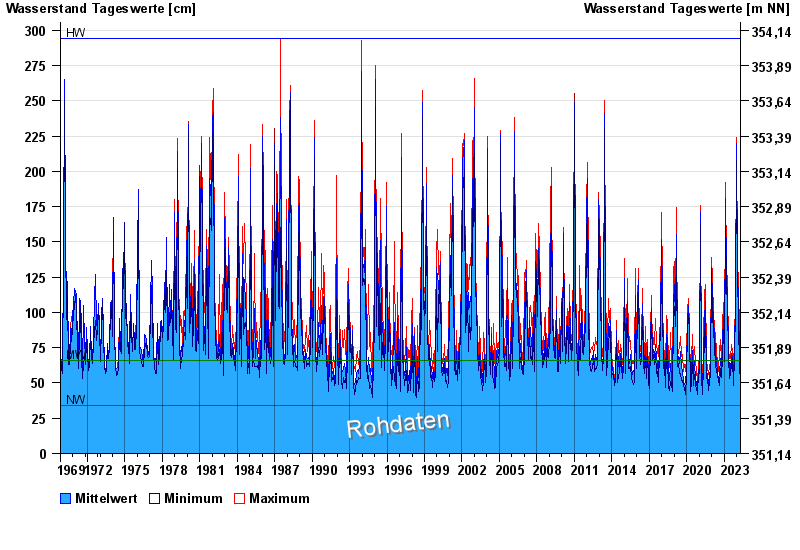
- Chart of total period

Chart of total period Schmidmühlen / Vils
Waterlevel from 01.11.1969 to 25.04.2024
| Date | Mean value [cm] | Maximum [cm] | Minimum [cm] |
|---|---|---|---|
| 25.04.2024 | 65 | 65 | 65 |
| 24.04.2024 | 67 | 69 | 65 |
| 23.04.2024 | 70 | 74 | 69 |
| 22.04.2024 | 77 | 81 | 74 |
| 21.04.2024 | 75 | 81 | 70 |
| 20.04.2024 | 72 | 77 | 64 |
| 19.04.2024 | 58 | 63 | 53 |
© Bayerisches Landesamt für Umwelt 2024