
- Start >
- Rivers >
- Waterlevel >
- Naab - Regen >
- Schmidmühlen >
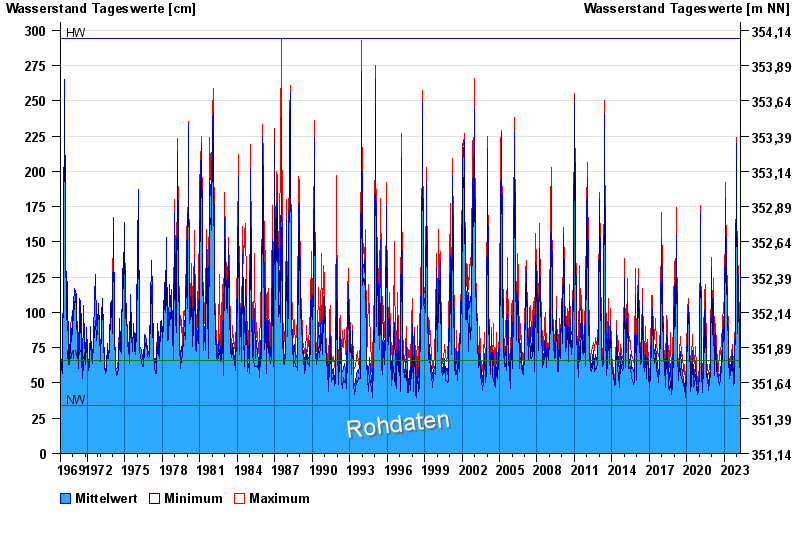
- Chart of total period

Chart of total period Schmidmühlen / Vils
Waterlevel from 01.11.1969 to 20.04.2024
| Date | Mean value [cm] | Maximum [cm] | Minimum [cm] |
|---|---|---|---|
| 20.04.2024 | 64 | 64 | 64 |
| 19.04.2024 | 58 | 63 | 53 |
| 18.04.2024 | 60 | 61 | 58 |
| 17.04.2024 | 61 | 71 | 57 |
| 16.04.2024 | 58 | 62 | 55 |
| 15.04.2024 | 57 | 60 | 54 |
| 14.04.2024 | 54 | 55 | 51 |
© Bayerisches Landesamt für Umwelt 2024