
- Start >
- Rivers >
- Waterlevel >
- Naab - Regen >
- Pressath >
- Chart of total period

Chart of total period Pressath / Haidenaab
Waterlevel from 01.11.1970 to 19.04.2024
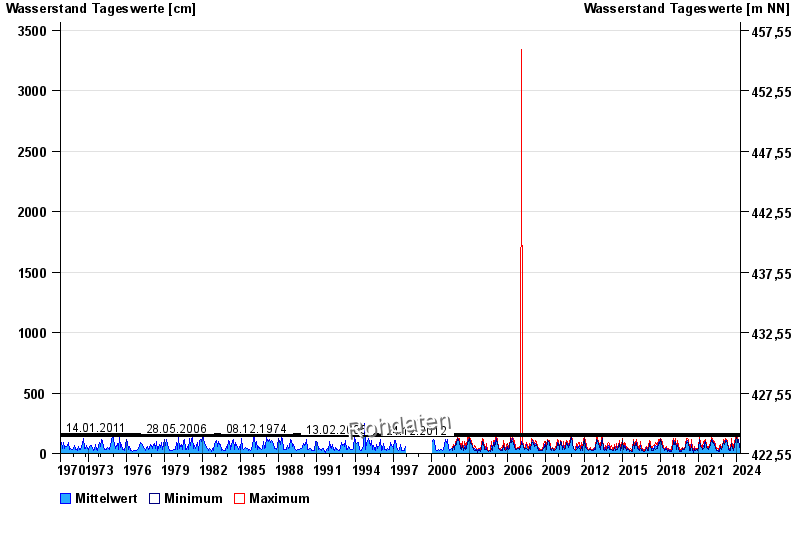
- 14.01.2011 Wasserstand: 163 cm
- 28.05.2006 Wasserstand: 155 cm
- 08.12.1974 Wasserstand: 155 cm
- 13.02.2005 Wasserstand: 146 cm
- 24.12.2012 Wasserstand: 144 cm
| Date | Mean value [cm] | Maximum [cm] | Minimum [cm] |
|---|---|---|---|
| 19.04.2024 | 32 | 37 | 30 |
| 18.04.2024 | 32 | 34 | 31 |
| 17.04.2024 | 36 | 42 | 33 |
| 16.04.2024 | 29 | 35 | 23 |
| 15.04.2024 | 28 | 35 | 25 |
| 14.04.2024 | 29 | 31 | 29 |
| 13.04.2024 | 30 | 31 | 25 |
© Bayerisches Landesamt für Umwelt 2024