
- Start >
- Rivers >
- Waterlevel >
- Naab - Regen >
- Plattling >
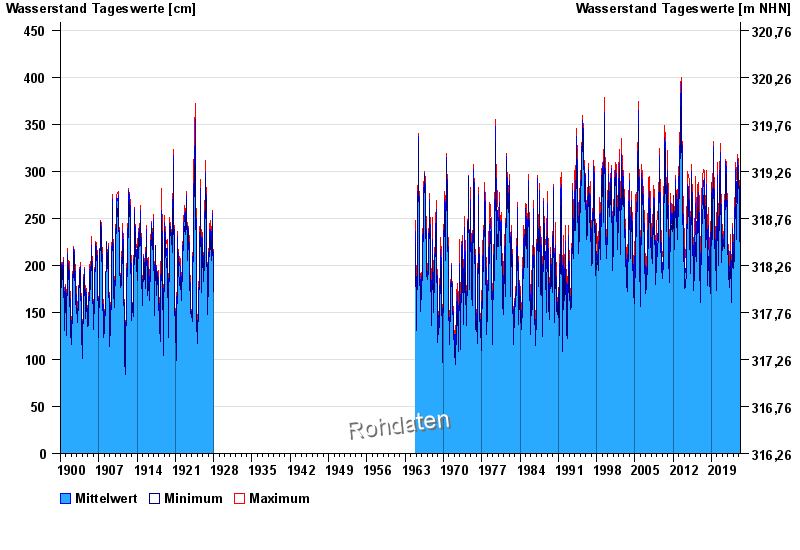
- Chart of total period

Chart of total period Plattling / Isar
Waterlevel from 01.01.1900 to 18.04.2024
| Date | Mean value [cm] | Maximum [cm] | Minimum [cm] |
|---|---|---|---|
| 18.04.2024 | 188 | 194 | 175 |
| 17.04.2024 | 175 | 180 | 168 |
| 16.04.2024 | 175 | 186 | 170 |
| 15.04.2024 | 170 | 173 | 165 |
| 14.04.2024 | 164 | 173 | 159 |
| 13.04.2024 | 162 | 170 | 154 |
| 12.04.2024 | 173 | 181 | 165 |
© Bayerisches Landesamt für Umwelt 2024