
- Start >
- Rivers >
- Waterlevel >
- Naab - Regen >
- Pfrentsch >
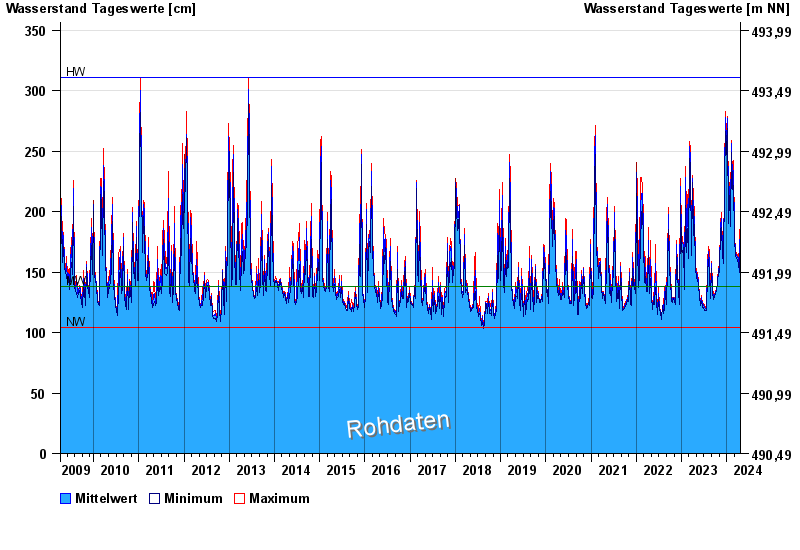
- Chart of total period

Chart of total period Pfrentsch / Pfreimd
Waterlevel from 08.04.2009 to 20.04.2024
| Date | Mean value [cm] | Maximum [cm] | Minimum [cm] |
|---|---|---|---|
| 20.04.2024 | 186 | 192 | 182 |
| 19.04.2024 | 182 | 185 | 179 |
| 18.04.2024 | 171 | 179 | 166 |
| 17.04.2024 | 161 | 167 | 153 |
| 16.04.2024 | 151 | 152 | 150 |
| 15.04.2024 | 146 | 151 | 142 |
| 14.04.2024 | 142 | 142 | 141 |
© Bayerisches Landesamt für Umwelt 2024