
- Start >
- Rivers >
- Waterlevel >
- Naab - Regen >
- Pfrentsch >
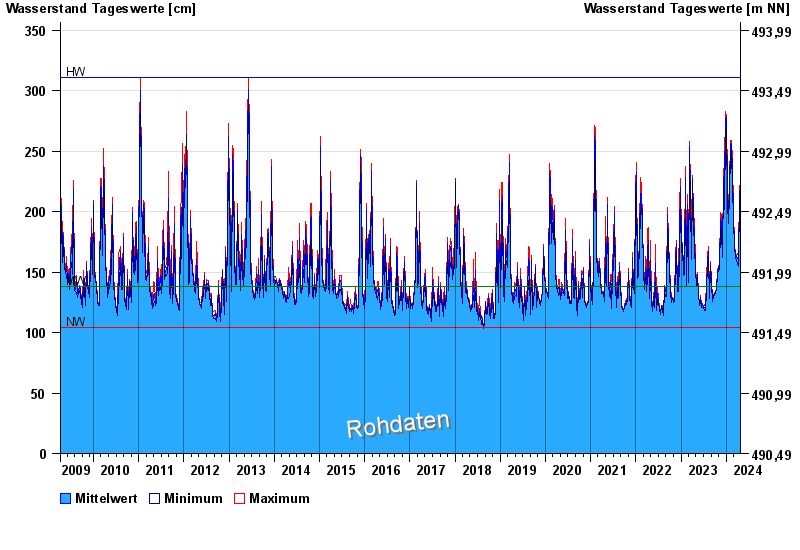
- Chart of total period

Chart of total period Pfrentsch / Pfreimd
Waterlevel from 08.04.2009 to 25.04.2024
| Date | Mean value [cm] | Maximum [cm] | Minimum [cm] |
|---|---|---|---|
| 25.04.2024 | 172 | 174 | 171 |
| 24.04.2024 | 180 | 188 | 174 |
| 23.04.2024 | 200 | 213 | 188 |
| 22.04.2024 | 221 | 224 | 213 |
| 21.04.2024 | 214 | 219 | 211 |
| 20.04.2024 | 203 | 219 | 182 |
| 19.04.2024 | 182 | 185 | 179 |
© Bayerisches Landesamt für Umwelt 2024