
- Start >
- Rivers >
- Waterlevel >
- Naab - Regen >
- Ösbühl >
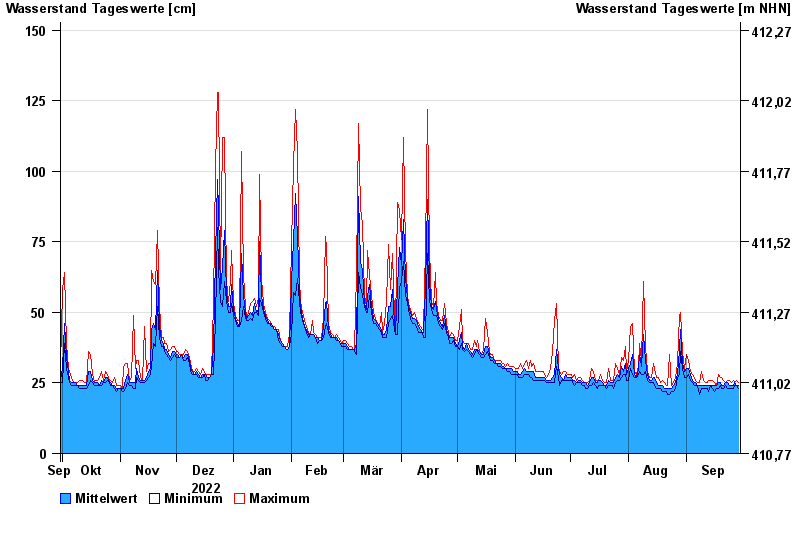
- Chart of year

Chart of year Ösbühl / Danglesbach
Waterlevel from 30.09.2022 to 29.09.2023
- 21.12.1993 Wasserstand: 175 cm
- 01.11.1998 Wasserstand: 174 cm
- 26.01.1995 Wasserstand: 174 cm
- 26.02.1997 Wasserstand: 167 cm
- 10.06.2013 Wasserstand: 163 cm
| Date | Mean value [cm] | Maximum [cm] | Minimum [cm] |
|---|---|---|---|
| 29.09.2023 | 24 | 25 | 23 |
| 28.09.2023 | 24 | 26 | 24 |
| 27.09.2023 | 25 | 25 | 24 |
| 26.09.2023 | 24 | 26 | 23 |
| 25.09.2023 | 24 | 25 | 23 |
| 24.09.2023 | 24 | 26 | 23 |
| 23.09.2023 | 25 | 26 | 23 |
© Bayerisches Landesamt für Umwelt 2024