
- Start >
- Rivers >
- Waterlevel >
- Naab - Regen >
- Neustadt >
- Chart of total period

Chart of total period Neustadt / Waldnaab
Waterlevel from 01.11.1970 to 24.04.2024
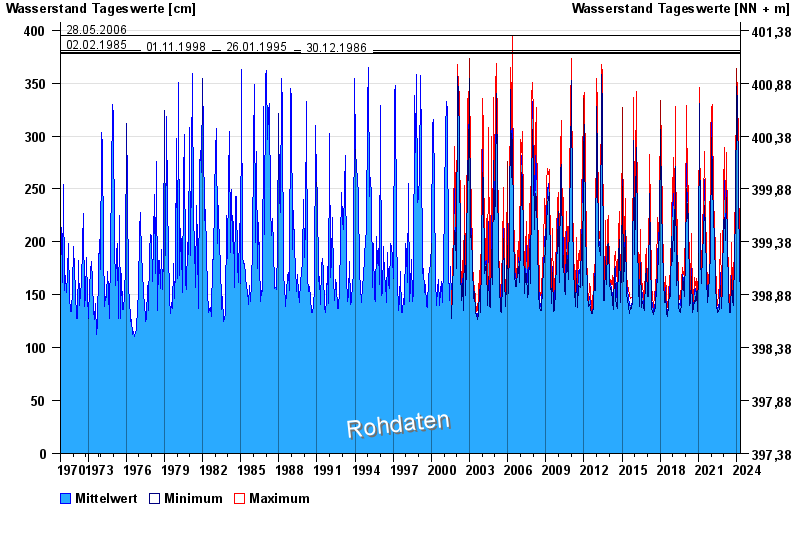
- 28.05.2006 Wasserstand: 395 cm
- 02.02.1985 Wasserstand: 381 cm
- 01.11.1998 Wasserstand: 379 cm
- 26.01.1995 Wasserstand: 379 cm
- 30.12.1986 Wasserstand: 378 cm
| Date | Mean value [cm] | Maximum [cm] | Minimum [cm] |
|---|---|---|---|
| 24.04.2024 | 175 | 175 | 175 |
| 23.04.2024 | 183 | 192 | 175 |
| 22.04.2024 | 190 | 196 | 185 |
| 21.04.2024 | 181 | 195 | 174 |
| 20.04.2024 | 176 | 184 | 160 |
| 19.04.2024 | 147 | 159 | 142 |
| 18.04.2024 | 149 | 152 | 145 |
© Bayerisches Landesamt für Umwelt 2024