
- Start >
- Rivers >
- Waterlevel >
- Naab - Regen >
- Marienthal >
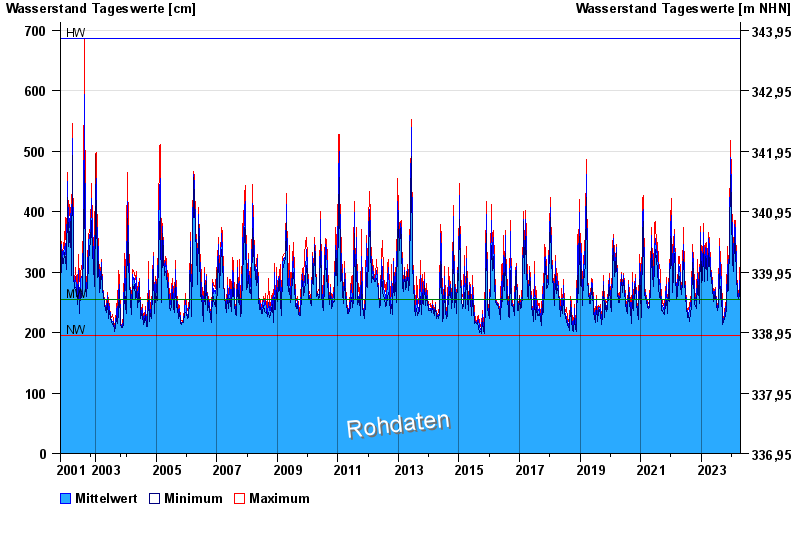
- Chart of total period

Chart of total period Marienthal / Regen
Waterlevel from 01.11.2001 to 20.04.2024
| Date | Mean value [cm] | Maximum [cm] | Minimum [cm] |
|---|---|---|---|
| 20.04.2024 | 283 | 283 | 283 |
| 19.04.2024 | 288 | 291 | 284 |
| 18.04.2024 | 278 | 286 | 270 |
| 17.04.2024 | 265 | 270 | 254 |
| 16.04.2024 | 249 | 254 | 245 |
| 15.04.2024 | 245 | 246 | 244 |
| 14.04.2024 | 246 | 247 | 244 |
© Bayerisches Landesamt für Umwelt 2024