
- Start >
- Rivers >
- Waterlevel >
- Naab - Regen >
- Langenbruck >
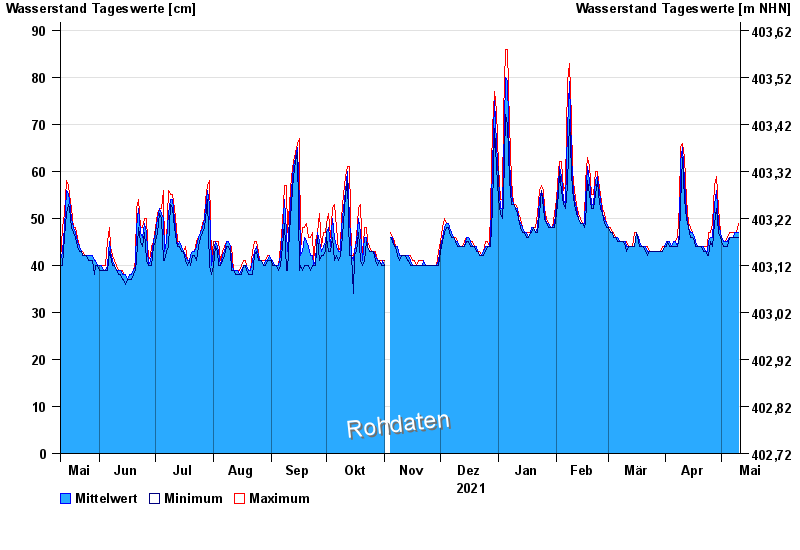
- Chart of year

Chart of year Langenbruck / Frankenohe
Waterlevel from 11.05.2021 to 10.05.2022
- 26.01.1995 Wasserstand: 193 cm
- 21.12.1993 Wasserstand: 181 cm
- 14.01.2011 Wasserstand: 176 cm
- 03.01.2003 Wasserstand: 174 cm
- 01.03.1990 Wasserstand: 172 cm
| Date | Mean value [cm] | Maximum [cm] | Minimum [cm] |
|---|---|---|---|
| 10.05.2022 | 47 | 49 | 46 |
| 09.05.2022 | 47 | 47 | 46 |
| 08.05.2022 | 47 | 47 | 46 |
| 07.05.2022 | 46 | 47 | 46 |
| 06.05.2022 | 46 | 47 | 46 |
| 05.05.2022 | 46 | 47 | 46 |
| 04.05.2022 | 45 | 46 | 44 |
© Bayerisches Landesamt für Umwelt 2024