
- Start >
- Rivers >
- Waterlevel >
- Naab - Regen >
- Johannisthal >
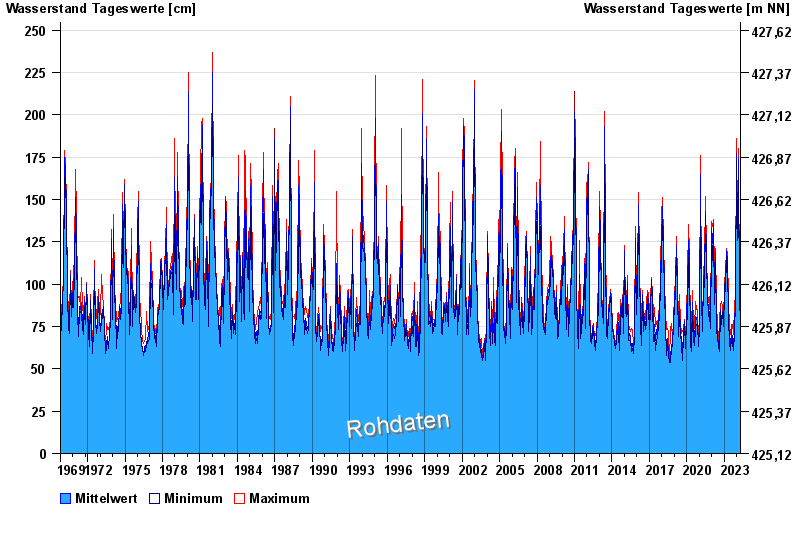
- Chart of total period

Chart of total period Johannisthal / Tirschenreuther Waldnaab
Waterlevel from 01.11.1969 to 17.04.2024
| Date | Mean value [cm] | Maximum [cm] | Minimum [cm] |
|---|---|---|---|
| 17.04.2024 | 74 | 76 | 72 |
| 16.04.2024 | 72 | 73 | 70 |
| 15.04.2024 | 71 | 80 | 70 |
| 14.04.2024 | 71 | 71 | 71 |
| 13.04.2024 | 72 | 73 | 71 |
| 12.04.2024 | 72 | 74 | 60 |
| 11.04.2024 | 74 | 74 | 72 |
© Bayerisches Landesamt für Umwelt 2024