
- Start >
- Rivers >
- Waterlevel >
- Naab - Regen >
- Hof >
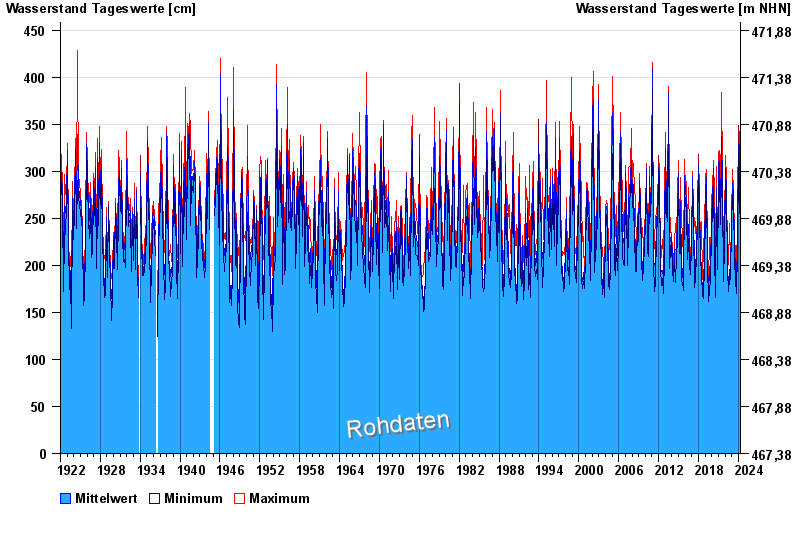
- Chart of total period

Chart of total period Hof / Sächsische Saale
Waterlevel from 06.01.1922 to 25.04.2024
| Date | Mean value [cm] | Maximum [cm] | Minimum [cm] |
|---|---|---|---|
| 25.04.2024 | 189 | 189 | 188 |
| 24.04.2024 | 190 | 200 | 177 |
| 23.04.2024 | 197 | 202 | 192 |
| 22.04.2024 | 209 | 213 | 202 |
| 21.04.2024 | 206 | 209 | 204 |
| 20.04.2024 | 197 | 205 | 183 |
| 19.04.2024 | 181 | 183 | 179 |
© Bayerisches Landesamt für Umwelt 2024