
- Start >
- Rivers >
- Waterlevel >
- Naab - Regen >
- Hof >
- Chart of total period

Chart of total period Hof / Sächsische Saale
Waterlevel from 06.01.1922 to 20.04.2024
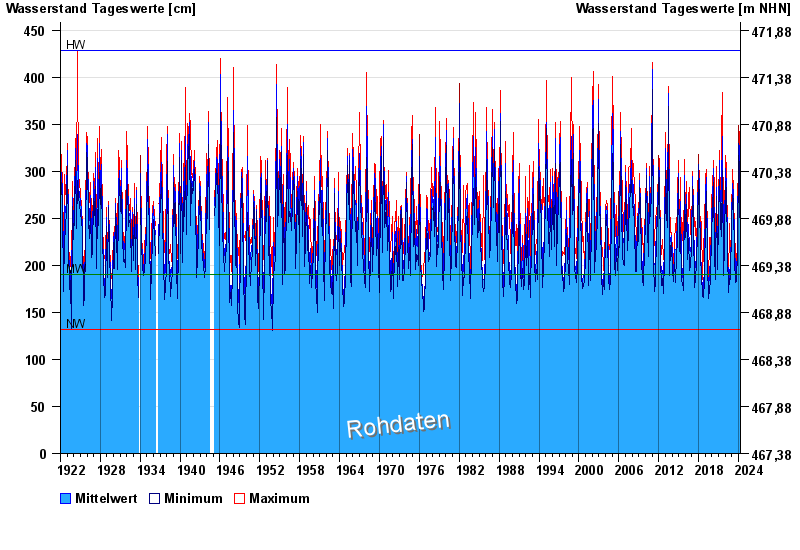
| Date | Mean value [cm] | Maximum [cm] | Minimum [cm] |
|---|---|---|---|
| 20.04.2024 | 186 | 189 | 183 |
| 19.04.2024 | 181 | 183 | 179 |
| 18.04.2024 | 184 | 186 | 180 |
| 17.04.2024 | 186 | 188 | 182 |
| 16.04.2024 | 178 | 183 | 175 |
| 15.04.2024 | 181 | 185 | 176 |
| 14.04.2024 | 185 | 186 | 185 |
© Bayerisches Landesamt für Umwelt 2024