
- Start >
- Rivers >
- Waterlevel >
- Naab - Regen >
- Hammerles >
- Chart of total period

Chart of total period Hammerles / Schweinnaab
Waterlevel from 17.05.2009 to 25.04.2024
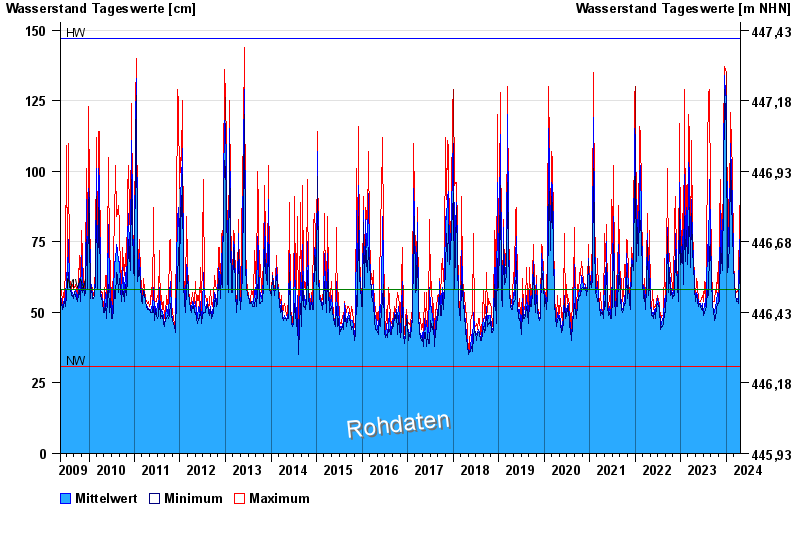
| Date | Mean value [cm] | Maximum [cm] | Minimum [cm] |
|---|---|---|---|
| 25.04.2024 | 66 | 68 | 66 |
| 24.04.2024 | 67 | 68 | 66 |
| 23.04.2024 | 70 | 72 | 68 |
| 22.04.2024 | 75 | 81 | 72 |
| 21.04.2024 | 76 | 88 | 67 |
| 20.04.2024 | 70 | 72 | 67 |
| 19.04.2024 | 62 | 72 | 59 |
© Bayerisches Landesamt für Umwelt 2024