
- Start >
- Rivers >
- Waterlevel >
- Naab - Regen >
- Grafenwöhr >
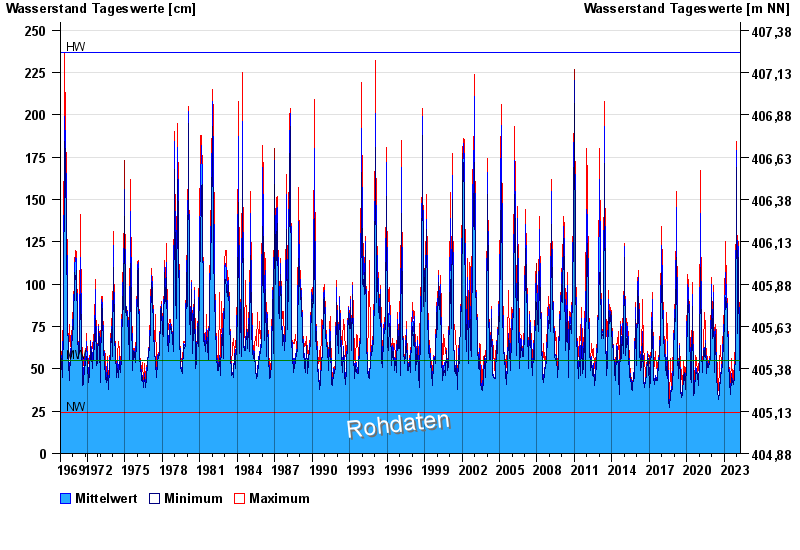
- Chart of total period

Chart of total period Grafenwöhr / Creußen
Waterlevel from 01.11.1969 to 19.04.2024
| Date | Mean value [cm] | Maximum [cm] | Minimum [cm] |
|---|---|---|---|
| 19.04.2024 | 52 | 53 | 52 |
| 18.04.2024 | 50 | 52 | 50 |
| 17.04.2024 | 49 | 51 | 46 |
| 16.04.2024 | 41 | 46 | 39 |
| 15.04.2024 | 40 | 40 | 40 |
| 14.04.2024 | 40 | 41 | 40 |
| 13.04.2024 | 40 | 41 | 40 |
© Bayerisches Landesamt für Umwelt 2024