
- Start >
- Rivers >
- Waterlevel >
- Naab - Regen >
- Grafenwöhr >
- Chart of total period

Chart of total period Grafenwöhr / Creußen
Waterlevel from 01.11.1969 to 23.04.2024
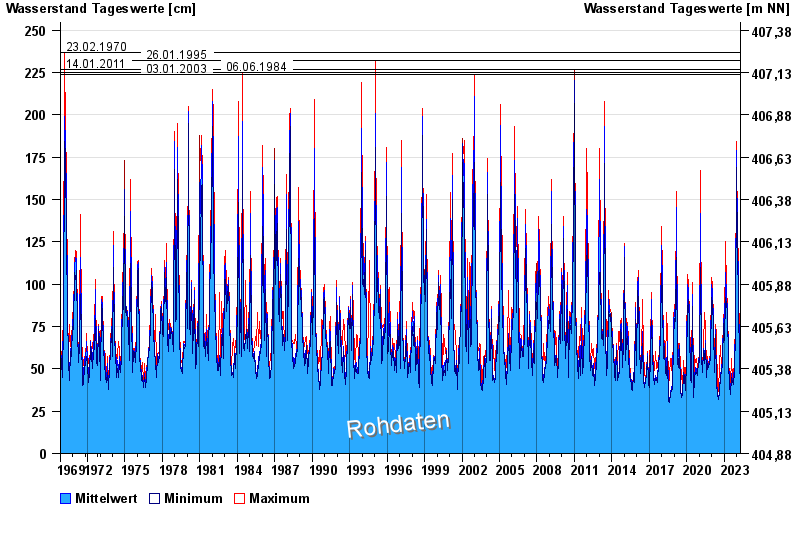
- 23.02.1970 Wasserstand: 237 cm
- 26.01.1995 Wasserstand: 232 cm
- 14.01.2011 Wasserstand: 227 cm
- 06.06.1984 Wasserstand: 225 cm
- 03.01.2003 Wasserstand: 224 cm
| Date | Mean value [cm] | Maximum [cm] | Minimum [cm] |
|---|---|---|---|
| 23.04.2024 | 69 | 70 | 67 |
| 22.04.2024 | 66 | 70 | 63 |
| 21.04.2024 | 61 | 62 | 59 |
| 20.04.2024 | 55 | 59 | 53 |
| 19.04.2024 | 52 | 53 | 52 |
| 18.04.2024 | 50 | 52 | 50 |
| 17.04.2024 | 49 | 51 | 46 |
© Bayerisches Landesamt für Umwelt 2024