
- Start >
- Rivers >
- Waterlevel >
- Naab - Regen >
- Eschlkam >
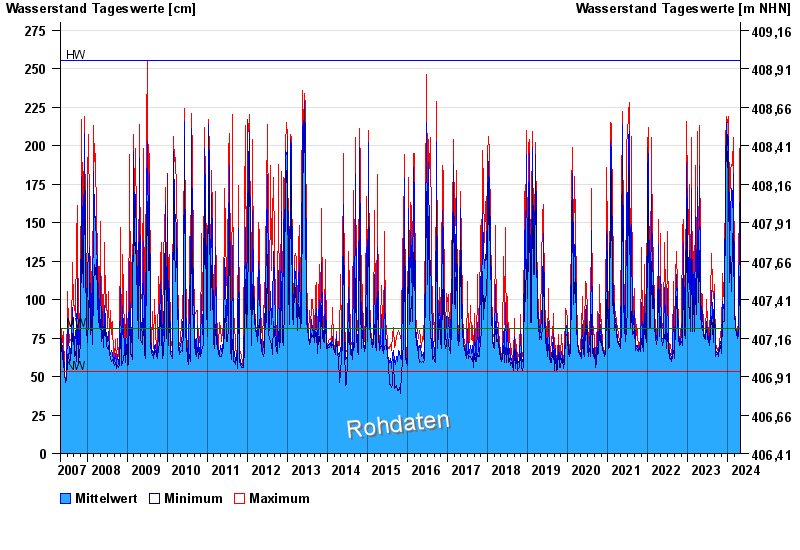
- Chart of total period

Chart of total period Eschlkam / Chamb
Waterlevel from 01.05.2007 to 25.04.2024
| Date | Mean value [cm] | Maximum [cm] | Minimum [cm] |
|---|---|---|---|
| 25.04.2024 | 83 | 83 | 83 |
| 24.04.2024 | 86 | 87 | 83 |
| 23.04.2024 | 90 | 94 | 87 |
| 22.04.2024 | 104 | 114 | 94 |
| 21.04.2024 | 105 | 114 | 97 |
| 20.04.2024 | 163 | 198 | 115 |
| 19.04.2024 | 115 | 178 | 95 |
© Bayerisches Landesamt für Umwelt 2024