
- Start >
- Rivers >
- Waterlevel >
- Naab - Regen >
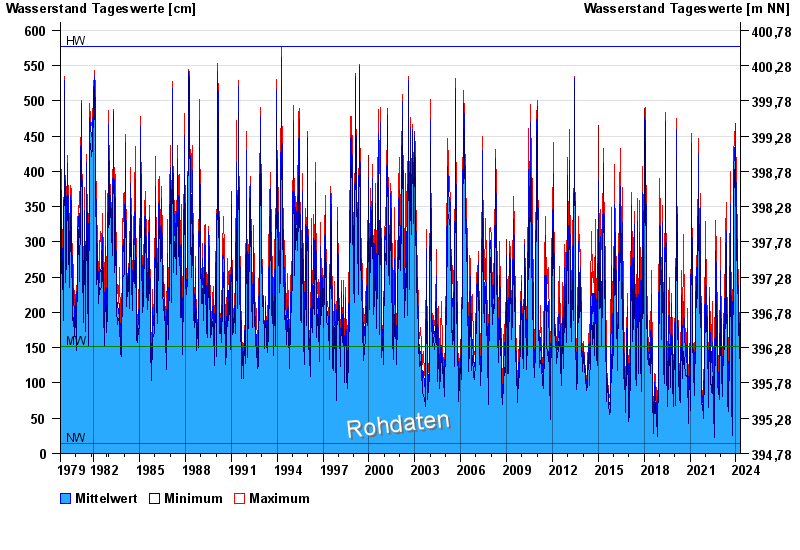
- Donauwörth >
- Chart of total period

Chart of total period Donauwörth / Donau
Waterlevel from 01.11.1979 to 18.04.2024
| Date | Mean value [cm] | Maximum [cm] | Minimum [cm] |
|---|---|---|---|
| 18.04.2024 | 138 | 141 | 133 |
| 17.04.2024 | 121 | 135 | 111 |
| 16.04.2024 | 125 | 132 | 117 |
| 15.04.2024 | 104 | 120 | 94 |
| 14.04.2024 | 95 | 102 | 89 |
| 13.04.2024 | 91 | 98 | 86 |
| 12.04.2024 | 90 | 100 | 83 |
© Bayerisches Landesamt für Umwelt 2024