
- Start >
- Rivers >
- Waterlevel >
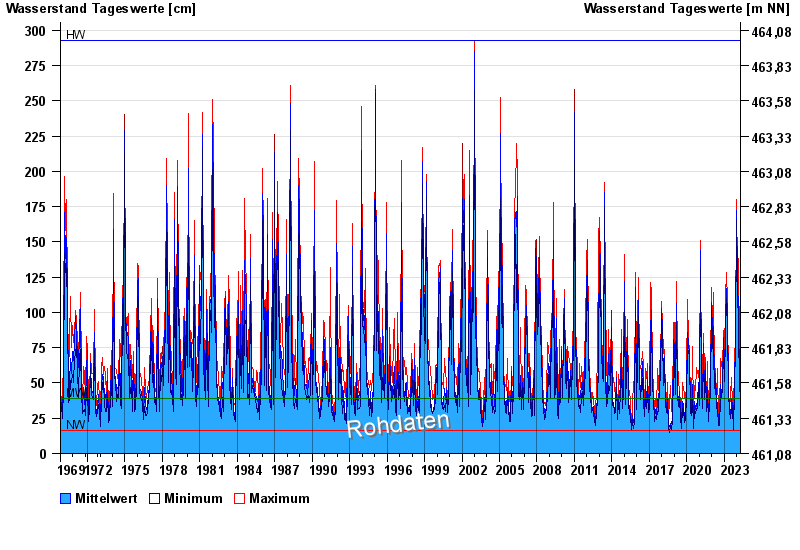
- Naab - Regen >
- Böhmischbruck >
- Chart of total period

Chart of total period Böhmischbruck / Pfreimd
Waterlevel from 01.11.1969 to 23.04.2024
| Date | Mean value [cm] | Maximum [cm] | Minimum [cm] |
|---|---|---|---|
| 23.04.2024 | 63 | 66 | 59 |
| 22.04.2024 | 68 | 70 | 66 |
| 21.04.2024 | 69 | 71 | 67 |
| 20.04.2024 | 67 | 72 | 61 |
| 19.04.2024 | 50 | 62 | 48 |
| 18.04.2024 | 47 | 48 | 45 |
| 17.04.2024 | 44 | 49 | 40 |
© Bayerisches Landesamt für Umwelt 2024