
- Start >
- Rivers >
- Waterlevel >
- Naab - Regen >
- Amberg >
- Chart of total period

Chart of total period Amberg / Vils
Waterlevel from 01.11.1969 to 16.04.2024
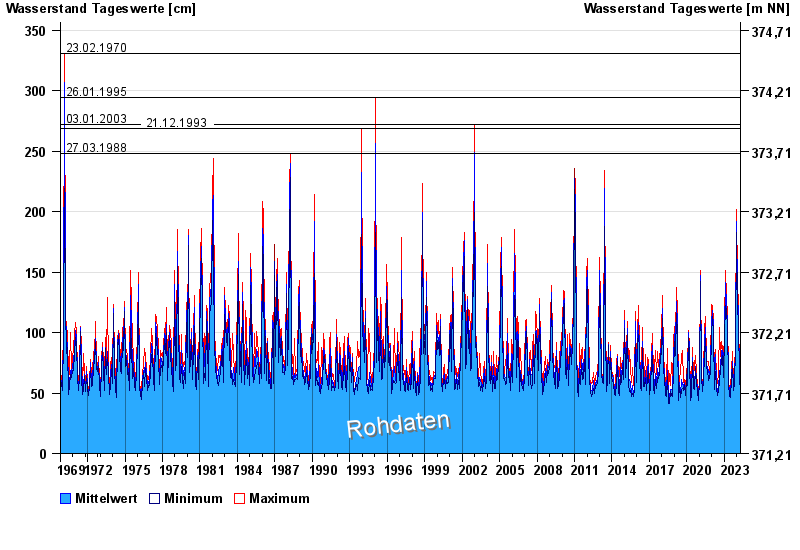
- 23.02.1970 Wasserstand: 331 cm
- 26.01.1995 Wasserstand: 294 cm
- 03.01.2003 Wasserstand: 272 cm
- 21.12.1993 Wasserstand: 269 cm
- 27.03.1988 Wasserstand: 248 cm
| Date | Mean value [cm] | Maximum [cm] | Minimum [cm] |
|---|---|---|---|
| 16.04.2024 | 54 | 56 | 52 |
| 15.04.2024 | 53 | 55 | 50 |
| 14.04.2024 | 52 | 53 | 50 |
| 13.04.2024 | 52 | 53 | 50 |
| 12.04.2024 | 52 | 54 | 51 |
| 11.04.2024 | 53 | 55 | 52 |
| 10.04.2024 | 54 | 55 | 52 |
© Bayerisches Landesamt für Umwelt 2024