
- Start >
- Rivers >
- Waterlevel >
- Unterer Main >
- Würzburg >
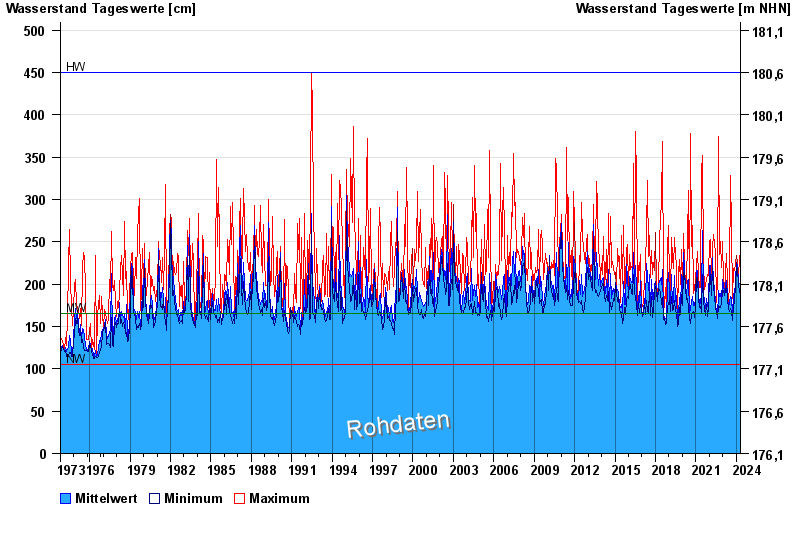
- Chart of total period

Chart of total period Würzburg / Pleichach
Waterlevel from 01.11.1973 to 25.04.2024
| Date | Mean value [cm] | Maximum [cm] | Minimum [cm] |
|---|---|---|---|
| 25.04.2024 | 190 | 191 | 189 |
| 24.04.2024 | 186 | 192 | 183 |
| 23.04.2024 | 186 | 188 | 185 |
| 22.04.2024 | 192 | 200 | 188 |
| 21.04.2024 | 202 | 211 | 183 |
| 20.04.2024 | 186 | 191 | 182 |
| 19.04.2024 | 185 | 196 | 181 |
© Bayerisches Landesamt für Umwelt 2024