
- Start >
- Rivers >
- Waterlevel >
- Unterer Main >
- Weilbach >
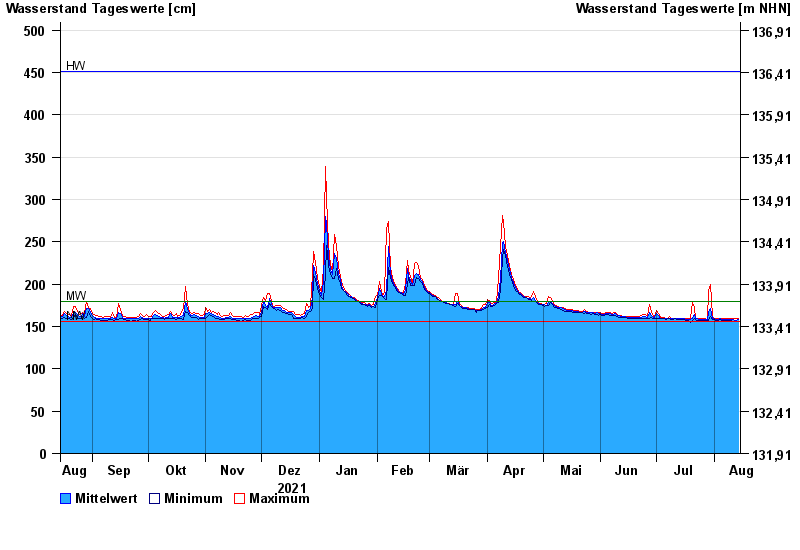
- Chart of year

Chart of year Weilbach / Mud
Waterlevel from 15.08.2021 to 14.08.2022
| Date | Mean value [cm] | Maximum [cm] | Minimum [cm] |
|---|---|---|---|
| 14.08.2022 | 158 | 159 | 156 |
| 13.08.2022 | 157 | 159 | 156 |
| 12.08.2022 | 157 | 159 | 156 |
| 11.08.2022 | 158 | 159 | 156 |
| 10.08.2022 | 158 | 159 | 157 |
| 09.08.2022 | 158 | 159 | 157 |
| 08.08.2022 | 158 | 159 | 157 |
© Bayerisches Landesamt für Umwelt 2024