
- Start >
- Rivers >
- Waterlevel >
- Unterer Main >
- Weilbach >
- Chart of year

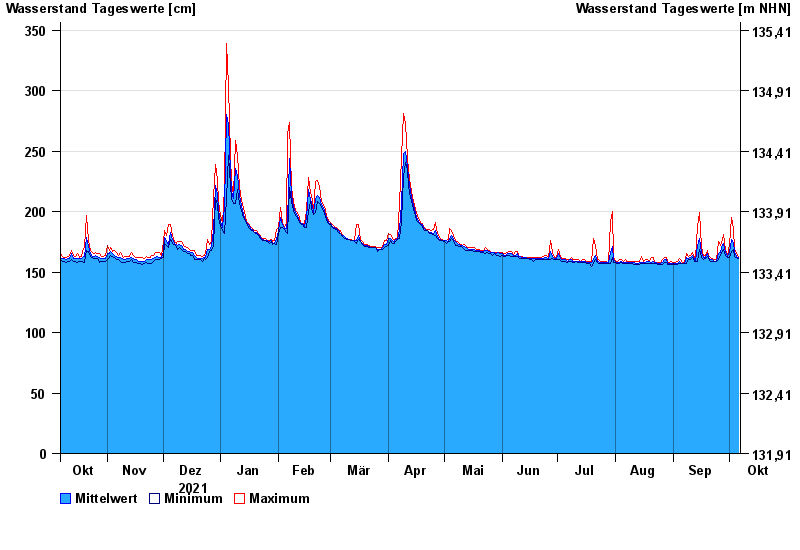
Chart of year Weilbach / Mud
Waterlevel from 07.10.2021 to 06.10.2022
- 26.01.1995 Wasserstand: 451 cm
- 21.12.1993 Wasserstand: 437 cm
- 22.02.1970 Wasserstand: 421 cm
- 29.10.1998 Wasserstand: 412 cm
- 16.03.1988 Wasserstand: 404 cm
| Date | Mean value [cm] | Maximum [cm] | Minimum [cm] |
|---|---|---|---|
| 06.10.2022 | 162 | 163 | 161 |
| 05.10.2022 | 163 | 165 | 162 |
| 04.10.2022 | 167 | 169 | 163 |
| 03.10.2022 | 174 | 185 | 169 |
| 02.10.2022 | 177 | 195 | 167 |
| 01.10.2022 | 166 | 173 | 162 |
| 30.09.2022 | 163 | 164 | 162 |
© Bayerisches Landesamt für Umwelt 2024