
- Start >
- Rivers >
- Waterlevel >
- Unterer Main >
- Vorra >
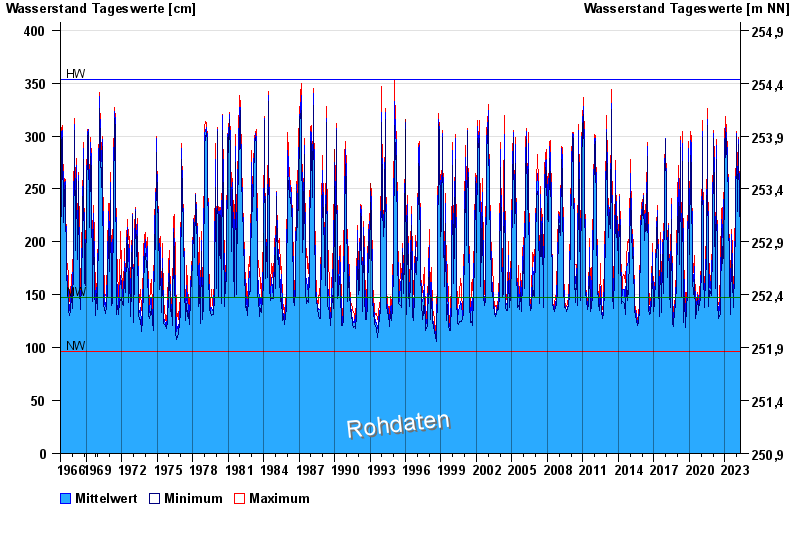
- Chart of total period

Chart of total period Vorra / Rauhe Ebrach
Waterlevel from 01.11.1966 to 26.04.2024
| Date | Mean value [cm] | Maximum [cm] | Minimum [cm] |
|---|---|---|---|
| 26.04.2024 | 200 | 200 | 200 |
| 25.04.2024 | 206 | 219 | 201 |
| 24.04.2024 | 239 | 249 | 219 |
| 23.04.2024 | 245 | 249 | 239 |
| 22.04.2024 | 230 | 239 | 218 |
| 21.04.2024 | 206 | 218 | 199 |
| 20.04.2024 | 201 | 215 | 166 |
© Bayerisches Landesamt für Umwelt 2024