
- Start >
- Rivers >
- Waterlevel >
- Unterer Main >
- Stockheim >
- Chart of total period

Chart of total period Stockheim / Sulz
Waterlevel from 01.11.1973 to 25.04.2024
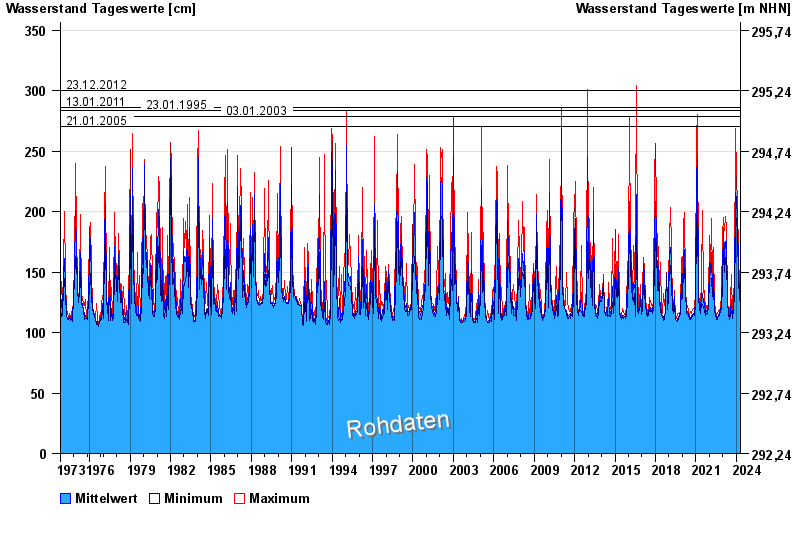
- 23.12.2012 Wasserstand: 300 cm
- 13.01.2011 Wasserstand: 286 cm
- 23.01.1995 Wasserstand: 284 cm
- 03.01.2003 Wasserstand: 279 cm
- 21.01.2005 Wasserstand: 270 cm
| Date | Mean value [cm] | Maximum [cm] | Minimum [cm] |
|---|---|---|---|
| 25.04.2024 | 119 | 119 | 119 |
| 24.04.2024 | 119 | 120 | 119 |
| 23.04.2024 | 120 | 121 | 119 |
| 22.04.2024 | 122 | 125 | 121 |
| 21.04.2024 | 125 | 128 | 123 |
| 20.04.2024 | 123 | 124 | 122 |
| 19.04.2024 | 120 | 124 | 118 |
© Bayerisches Landesamt für Umwelt 2024