
- Start >
- Rivers >
- Waterlevel >
- Unterer Main >
- Schweinhof >
- Chart of total period

Chart of total period Schweinhof / Brend
Waterlevel from 01.11.1982 to 18.04.2024
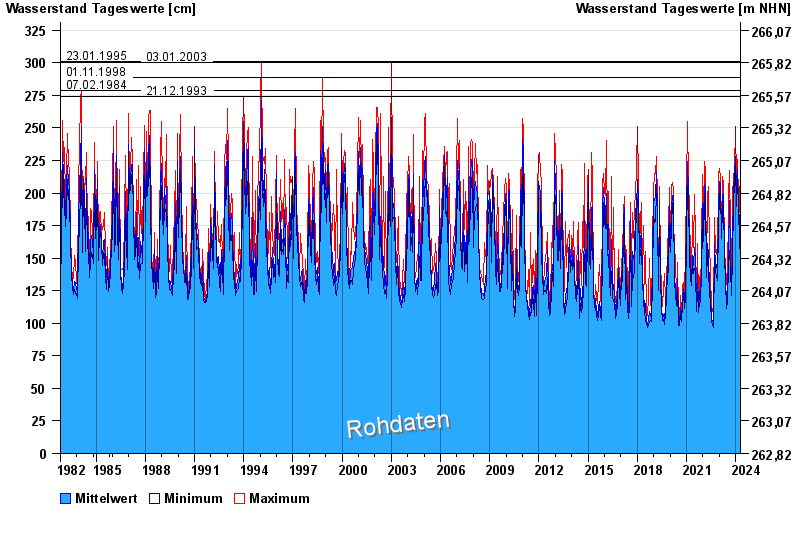
- 23.01.1995 Wasserstand: 301 cm
- 03.01.2003 Wasserstand: 300 cm
- 01.11.1998 Wasserstand: 289 cm
- 07.02.1984 Wasserstand: 279 cm
- 21.12.1993 Wasserstand: 274 cm
| Date | Mean value [cm] | Maximum [cm] | Minimum [cm] |
|---|---|---|---|
| 18.04.2024 | 146 | 148 | 145 |
| 17.04.2024 | 148 | 154 | 145 |
| 16.04.2024 | 149 | 164 | 141 |
| 15.04.2024 | 140 | 147 | 139 |
| 14.04.2024 | 141 | 141 | 139 |
| 13.04.2024 | 142 | 142 | 141 |
| 12.04.2024 | 143 | 144 | 142 |
© Bayerisches Landesamt für Umwelt 2024