
- Start >
- Rivers >
- Waterlevel >
- Unterer Main >
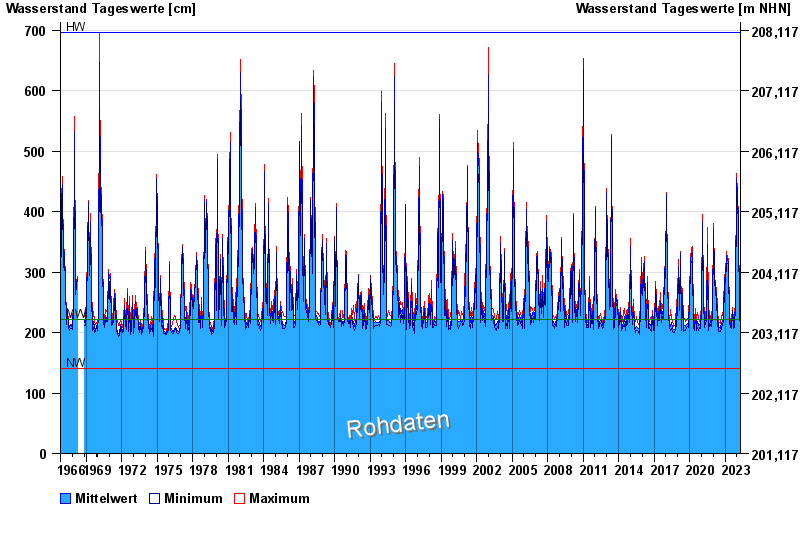
- Schweinfurt Neuer Hafen >
- Chart of total period

Chart of total period Schweinfurt Neuer Hafen / Main
Waterlevel from 01.11.1966 to 18.04.2024
| Date | Mean value [cm] | Maximum [cm] | Minimum [cm] |
|---|---|---|---|
| 18.04.2024 | 218 | 219 | 217 |
| 17.04.2024 | 217 | 224 | 212 |
| 16.04.2024 | 212 | 214 | 210 |
| 15.04.2024 | 211 | 214 | 207 |
| 14.04.2024 | 211 | 216 | 208 |
| 13.04.2024 | 211 | 213 | 208 |
| 12.04.2024 | 212 | 214 | 209 |
© Bayerisches Landesamt für Umwelt 2024