
- Start >
- Rivers >
- Waterlevel >
- Unterer Main >
- Scheinfeld >
- Chart of total period

Chart of total period Scheinfeld / Scheine
Waterlevel from 29.09.2006 to 25.04.2024
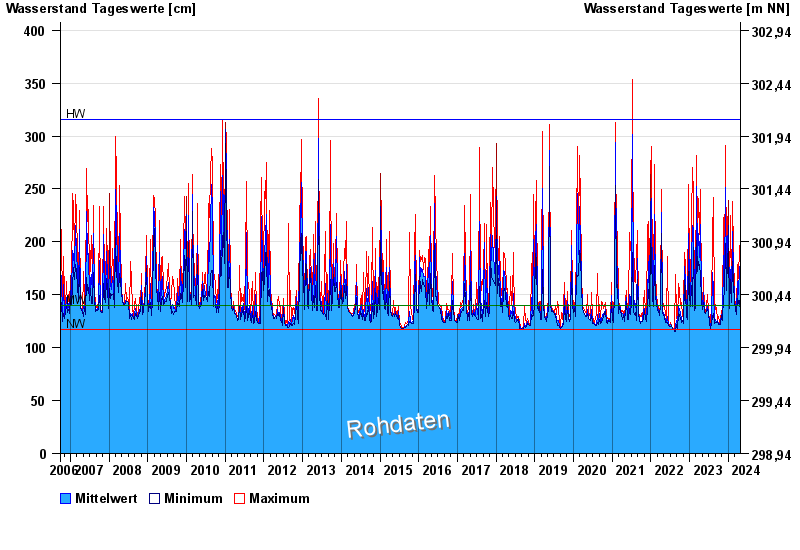
| Date | Mean value [cm] | Maximum [cm] | Minimum [cm] |
|---|---|---|---|
| 25.04.2024 | 138 | 138 | 138 |
| 24.04.2024 | 139 | 141 | 138 |
| 23.04.2024 | 145 | 150 | 141 |
| 22.04.2024 | 163 | 183 | 150 |
| 21.04.2024 | 177 | 197 | 138 |
| 20.04.2024 | 147 | 160 | 139 |
| 19.04.2024 | 139 | 161 | 130 |
© Bayerisches Landesamt für Umwelt 2024