
- Start >
- Rivers >
- Waterlevel >
- Unterer Main >
- Salz >
- Chart of total period

Chart of total period Salz / Fränkische Saale
Waterlevel from 01.11.1969 to 23.04.2024
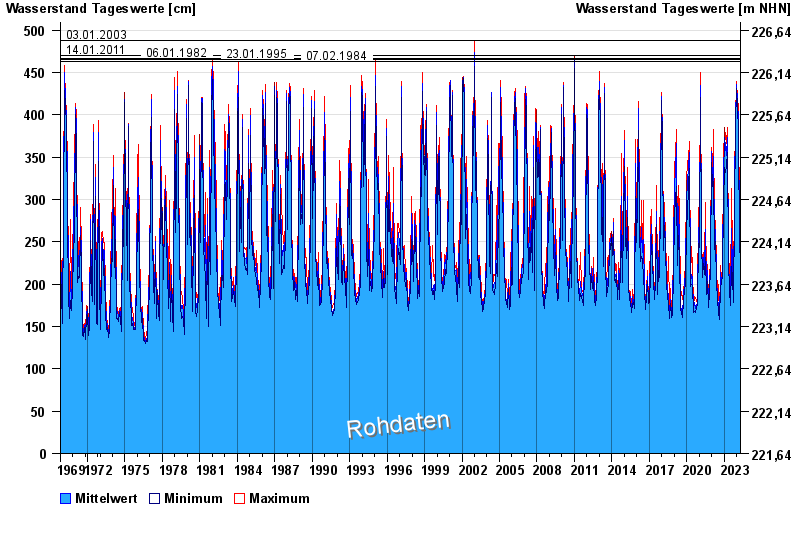
- 03.01.2003 Wasserstand: 488 cm
- 14.01.2011 Wasserstand: 470 cm
- 06.01.1982 Wasserstand: 466 cm
- 23.01.1995 Wasserstand: 465 cm
- 07.02.1984 Wasserstand: 463 cm
| Date | Mean value [cm] | Maximum [cm] | Minimum [cm] |
|---|---|---|---|
| 23.04.2024 | 230 | 231 | 228 |
| 22.04.2024 | 236 | 244 | 230 |
| 21.04.2024 | 245 | 253 | 233 |
| 20.04.2024 | 238 | 244 | 232 |
| 19.04.2024 | 217 | 239 | 209 |
| 18.04.2024 | 213 | 214 | 211 |
| 17.04.2024 | 218 | 220 | 215 |
© Bayerisches Landesamt für Umwelt 2024