
- Start >
- Rivers >
- Waterlevel >
- Unterer Main >
- Poppenlauer >
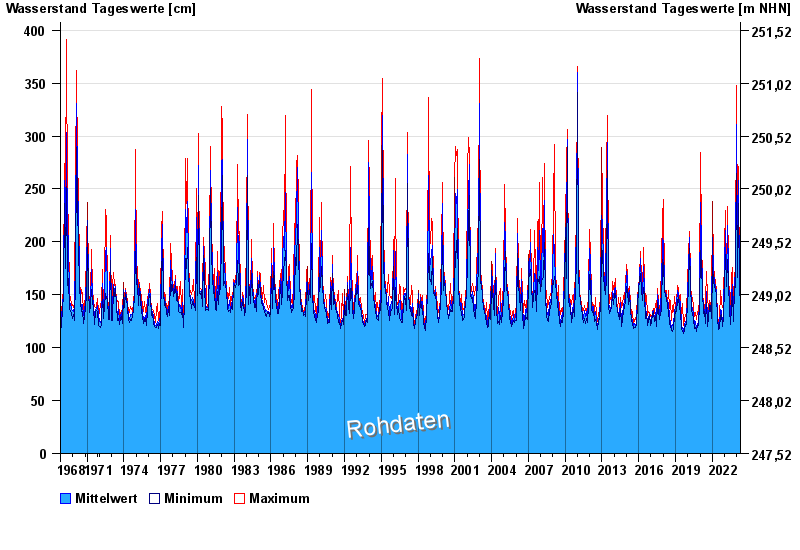
- Chart of total period

Chart of total period Poppenlauer / Lauer
Waterlevel from 01.11.1968 to 20.04.2024
| Date | Mean value [cm] | Maximum [cm] | Minimum [cm] |
|---|---|---|---|
| 20.04.2024 | 150 | 150 | 149 |
| 19.04.2024 | 143 | 151 | 141 |
| 18.04.2024 | 141 | 142 | 141 |
| 17.04.2024 | 141 | 143 | 132 |
| 16.04.2024 | 140 | 152 | 139 |
| 15.04.2024 | 138 | 139 | 138 |
| 14.04.2024 | 139 | 139 | 138 |
© Bayerisches Landesamt für Umwelt 2024