
- Start >
- Rivers >
- Waterlevel >
- Unterer Main >
- Pfarrweisach >
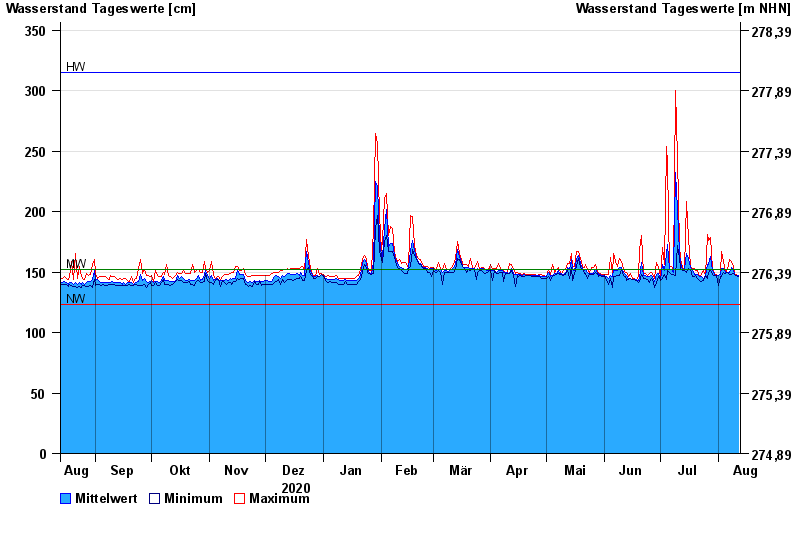
- Chart of year

Chart of year Pfarrweisach / Weisach
Waterlevel from 13.08.2020 to 12.08.2021
| Date | Mean value [cm] | Maximum [cm] | Minimum [cm] |
|---|---|---|---|
| 12.08.2021 | 147 | 147 | 146 |
| 11.08.2021 | 147 | 148 | 147 |
| 10.08.2021 | 148 | 149 | 148 |
| 09.08.2021 | 151 | 155 | 149 |
| 08.08.2021 | 154 | 159 | 148 |
| 07.08.2021 | 150 | 160 | 148 |
| 06.08.2021 | 150 | 152 | 150 |
© Bayerisches Landesamt für Umwelt 2024